

ARCHIVE
Vol. 1, No. 1
JANUARY-JUNE, 2011
Research Articles
Research Notes and Statistics
Symposium
Book Reviews
Agricultural Employment in a
Results from a Resurvey
R. Ramakumar* and Karankumar Raut†
*Associate Professor, School of Social Sciences, Tata Institute of Social Sciences, Mumbai.
†M. Phil. student, Tata Institute of Social Sciences, Mumbai.
Abstract: Vidarbha is a region in which, historically and in the contemporary period, the share of agricultural workers in the working population has been among the highest in the country. This paper discusses the ways in which changes in production conditions between the 1960s and 2000s in one western Vidarbha village – Dongargaon – influenced (a) the number of days of employment for agricultural labourers; (b) the levels of labour absorption in agriculture; and (c) the changes in the nature and extent of labour absorption in agriculture. Such a comparative study was facilitated by the availability of data and information from two surveys of the village: the first in 1963–64 by V. H. Joshi, and a resurvey in 2007 by a team led by the first author.
The paper argues that the aggregate number of days of employment gained by agricultural labourers in Dongargaon increased between 1963–64 and 2006–07. This argument is based on indirect evidence with respect to changes in labour absorption in the cultivation of different crops. However, the data and analysis presented in this paper show that, because of increases in the absolute number of agricultural workers and in the share of agricultural workers in the work force, increased labour absorption did not result in a proportionate rise in the number of days of employment available to an individual worker. In 2006–07, primary agricultural labourers in Dongargaon were employed only for about 111 days a year. Underemployment was thus a feature of the life of agricultural labourers. Lack of access to adequate non-agricultural employment, rising landlessness, and large-scale immigration of workers into the village undermined the potential gains of a rise in labour absorption.
Keywords: Vidarbha, village surveys, rural employment, labour absorption, migration.
This
paper deals with the employment status of agricultural labourers
in a village, Dongargaon, in the Vidarbha
region of Maharashtra. Specifically, it attempts to answer the following
questions. For how many days in a year, on average, did agricultural labourers in the village find employment? Did the number of
days of employment obtained by them differ across social groups, and between
men and women? To what extent did each of the different crops grown in the
village provide employment to the agricultural labourers?
What was the relative importance of agricultural and non-agricultural
employment in the employment profile of the labourers?
The
number of days of employment obtained by agricultural labourers
is affected by both “demand” and “supply” factors. Both historically and in the
contemporary period, Vidarbha has been known to be a
region with the highest share of India’s agricultural labourers.
Given the high incidence of agricultural labourers in
the region, this paper discusses the ways in which changes in production
conditions in the village under study influenced labour
absorption in agriculture between the 1960s and 2000s. In particular, it
analyses the ways in which the spread of irrigation, changes in cropping
pattern, and changes in techniques of production affected the number of days of
agricultural employment in the village during these decades.
The
primary data used in the paper are from a resurvey, conducted in 2007, of Dongargaon. The village was first surveyed in 1963–64;
information from the earlier survey is used here as a benchmark to compare and analyse the changes in labour
absorption in agriculture between then and 2007.
Days of Employment of Agricultural Labourers:
Sources of Data
The only available source of secondary data on
employment of agricultural labourers in India is the quinquennial
Employment and Unemployment surveys of the National Sample Survey Organization
(NSSO). Data on the number of days of employment of agricultural labourers are
extracted from the NSSO surveys and published separately as the Rural Labour Enquiry (RLE) by the Ministry of Labour,
Government of India.
This paper uses data on the category of usually occupied
workers belonging to rural labour households (RLHs)
from the presentation of results in the RLE
(see Table 1). In 2004–05, which is the last available round of the NSS, the
average number of days of wage employment for usually occupied workers in RLHs in Maharashtra was recorded as 225 days for men and
202 days for women. In other words, male workers were employed for 61 per cent
of the days in the year and female workers for 55 per cent of the days in the
year.
The RLE data
also show that workers from Scheduled Caste (SC) RLHs
in Maharashtra were employed for a marginally higher number of days in the year
2004–05. Male workers from SC RLHs were employed for
232 days and female workers from SC RLHs were
employed for 214 days.
Table 1 Average number of days of wage employment of usually occupied workers in agricultural labour belonging to RLHs, Maharashtra, RLE, 1977–78 to 2004–05, in number of full days
|
RLE round/year |
Average annual number of days of
employment for |
|||
|
Men |
Women |
|||
|
All workers |
SC workers |
All workers |
SC workers |
|
|
1977–78 |
250 |
232 |
198 |
202 |
|
1983 |
234 |
229 |
184 |
188 |
|
1987–88 |
247 |
256 |
145 |
119 |
|
1993–94 |
237 |
228 |
219 |
207 |
|
1999–2000 |
225 |
223 |
210 |
202 |
|
2004–05 |
225 |
232 |
202 |
214 |
Note: SC=Scheduled Caste; RLE=Rural Labour Enquiry; RLH=rural labour households.
Source: Bamezai (2010).
Scholars who work with primary data on Indian villages have for long questioned the reliability of the RLE data on the number of days of employment. They have argued that the average number of days of wage employment of agricultural labourers is considerably lower, in reality, than the RLE estimates. For instance, Ramachandran and Swaminathan (2004) note that:
… we do not have good enough macro-data on the number of days of employment, agricultural and non-agricultural, per worker per year in India. Not only do the data from the Rural Labour Enquiries appear intuitively to be incorrect … it is also well-recognized that employment data from micro studies show consistently lower volumes of employment than Rural Labour Enquiry data.
Mukherjee (1998; cited in Bamezai 2010) states that the differences between NSS/RLE data and village studies data can be
explained in terms of an inbuilt, upward bias in the collection and
classification of data by the NSS/RLE.
According to the methodology adopted by the NSS/RLE, an individual is considered to be “employed” for a full day if
s/he is engaged in gainful employment for four hours or more, and for half a day
if s/he is engaged in gainful employment for one hour or more. Such an approach
leads to classification (i) of a larger number of
individuals as gainfully “employed”; and (ii) of individuals engaged in low
income-generating “replacement activities”, for lack of gainful employment
opportunities, as gainfully “employed”. Mukherjee
further points out that most village studies record only the number of days of
gainful employment and hence a lower number of days of employment in a year.
In sum, RLE
data on the days of employment of agricultural labourers are inadequate to
understand the conditions of employment in rural India. Primary data from
village studies provide more meaningful estimates of the days of employment of
rural workers. Further, primary data help us to understand various
socio-economic characteristics of agricultural labour. For instance,
field-level data allow us to study the links between specific farming and
cropping patterns, on the one hand, and the number of days of employment of
labourers, on the other (which is not possible with secondary data).
The
Study Region and the Database
Dongargaon belongs to Akola tehsil
in Akola district, in the Vidarbha region of
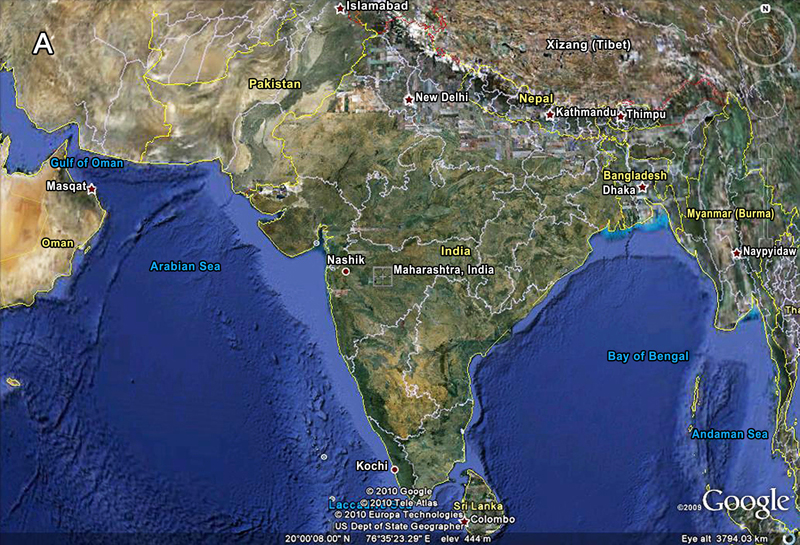
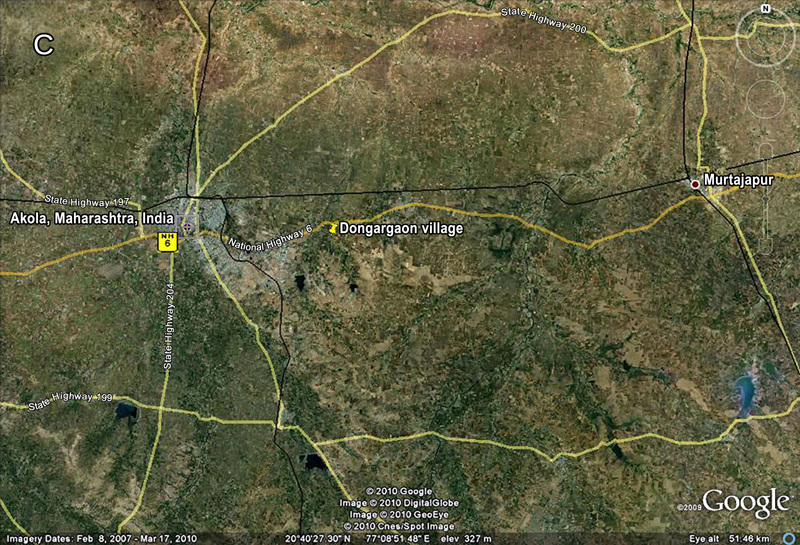
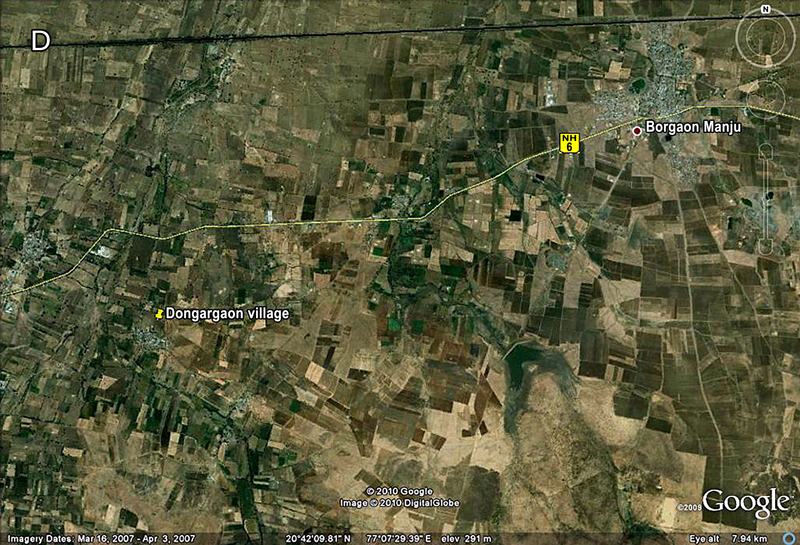
Maharashtra (see Map Panel). The village is located at a distance of about 13 kilometres
from the town of Akola on the National Highway (NH) 6 that connects Akola to
Amravati and Nagpur. The village settlement (gaothan) is situated at less than
1 kilometre off NH 6, towards the south. The market-town of Murtizapur
is about 32 kilometres away from the village, to the east. Dongargaon
is surrounded by the villages of Sisa, Masa, Kumbhari, and Babulgaon, located at distances of between 3 to 5
kilometres.
Map Panel
(from top to bottom): Map of India showing Maharashtra State; Map
of Maharashtra showing Dongargaon in Akola district; Location of Dongargaon
between Akola and Murtizapur towns; A closer view of the location of
Dongargaon and the nearby Borgaon market

This paper is based on data collected from the village
of Dongargaon as part of a larger study of agrarian
relations in the villages of Maharashtra. Dongargaon
was surveyed by the study team of investigators in the summer of 2007, with
agricultural year 2006–07 as the reference year. At the time of the survey
there were 357 households in the village, and a census-type socio-economic
survey was conducted of all 357 households using detailed questionnaires (see
Table 2 for the demographic and agricultural details of the village). The survey began in the last week of April 2007 and was completed
by the third week of May the same year. An earlier survey of Dongargaon had been conducted in 1963, by V. H. Joshi of
the College of Agriculture, Akola (see Joshi 1967).
Table 2 Some basic demographic and agricultural details of Dongargaon, 2007 in number, acres and per cent
|
Item |
Number/ |
Share in total
population/ |
|
Total number of households |
357 |
- |
|
Total population |
1680 |
- |
|
Number of men |
855 |
51.0 |
|
Number of women |
825 |
49.2 |
|
Total number of SC households |
161 |
45.1 |
|
Total number of ST households |
45 |
12.6 |
|
Total number of VJNT households |
14 |
3.9 |
|
Population (>6 yrs) who are fully literate |
1202 |
80.3 |
|
Population (>6 yrs) who never went to school |
258 |
17.2 |
|
Average household size |
4.7 |
- |
|
Number of workers with primary occupation as: |
|
|
|
Agricultural labourer |
362 |
46.6 |
|
Cultivator |
246 |
31.7 |
|
Total area under ownership holdings (acres) |
668.3 |
- |
|
Extent of area irrigated |
270.5 |
40.5 |
|
Share of area owned by the top 5 per cent of households |
- |
46.0 |
Note: SC=Scheduled Caste; ST=Scheduled Tribe; VJNT=Vimuktya Jati and Nomadic Tribes.
Source: Survey data 2007.
There were five major caste groups among the
households of Dongargaon: Maratha, Mali, Chambhar, Navbaudh, and Gowari. Of these, the Navbaudhs (Dalit/SC) were the largest group, constituting 28.1 per
cent of the population. Malis (OBC or Other Backward Classes)
constituted 17.4 per cent, Chambhars (Dalit/SC) 13.8 per cent, and Marathas (Other Caste) 12 per
cent of the population. The share in population of Gowaris
(Adivasi/ST) was 8 per cent.
Dongargaon’s
Location in a Labour-surplus Region
Dongargaon is located in the Berar area of western Vidarbha, a region which, as mentioned earlier, has the highest incidence of agricultural labourers in India (see Reddy 1988).1 The growth of a large population of landless agricultural workers in Berar began during the cotton boom of the 1860s and continued well into the twentieth century. Using two different sources and estimates, Reddy (1988) shows that while in the 1860s, agricultural labourers in Berar accounted for between 14 to 33 per cent of the total work force, by the 1881 Census, the proportion of agricultural labourers had risen sharply, to about 50 per cent. In conclusion, he notes that:
... right through the regime of agrarian expansion beginning from the 1860s and ending in the 1920s, there were processes which created a substantial “demand” for agricultural labour in Berar, while market forces and colonial regulations maintained a high “supply’ of landless labour. (ibid., p. 202)
Even at the 2001 Census, more than 50 years after
India’s Independence, Berar claimed the largest share of India’s agricultural
labourers (see Ramakumar, Raut, and Kumar 2009),
showing that the supply of labour to Berar’s agrarian economy proceeded
unhindered over all these years. At the state level too, in 2001, the share of
agricultural labourers in the work force of Amravati division (which roughly
comprises Berar and includes Akola district), at 53.7 per cent, was the highest
in Maharashtra. Between 1961 and 2001, the share of agricultural labourers in
Amravati’s work force increased by 1.3 per cent, from 52.4 to 53.7 per cent.
Among the female work force the rise in share was higher: 65.4 per cent of the
female workers in Amravati division were agricultural labourers in 2001, as
opposed to 62.5 per cent in 1961. Among the Scheduled Caste (SC) workers of
Amravati, 72.6 per cent were agricultural labourers in 2001; and the share of
female SC agricultural labourers, at 82.1 per cent, was even higher.
In sum, it is clear that Berar is home to a large and
growing population of agricultural labourers, and that Dalits
constitute a significant share of the agricultural labour work force of the
region.
The village of Dongargaon shares the above characteristics with Berar (see Ramakumar, Raut, and Kumar 2009), as revealed by the following data. (i) Census of India data show that there was a dramatic increase in the share of workers employed as agricultural labourers in the village between 1961 and 2001, from 47.7 per cent to 71.1 per cent. (ii) During every inter-censal period between 1961 and 2001, except 1991–2001, the rate of increase in the number of agricultural labourers in the village was higher than the rate of increase of the population.2 In other words, there were major changes in the internal composition of the work force of Dongargaon between 1961 and 2001. (iii) A comparison of data from the 2007 survey with Joshi’s 1967 data shows that, between 1963–64 and 2006–07, Dongargaon registered a rise in the share of workers with agricultural labour as their primary occupation. (iv) The dependence on agricultural employment in the village was higher for female workers as compared to male workers. In 2006–07, agricultural labour was the primary occupation for 37.2 per cent of the male workers, while the corresponding share for female workers was 60.8 per cent (see Table 3 for details).
Table 3 Distribution of workers by primary occupation, by sex, Dongargaon, 2006–07 in numbers and per cent
|
Primary occupation |
Male
workers |
Female
workers |
All
workers |
|||
|
Number |
Share |
Number |
Share |
Number |
Share |
|
|
Agricultural labour |
174 |
37.2 |
188 |
60.8 |
362 |
46.6 |
|
Cultivation |
149 |
31.8 |
97 |
31.4 |
246 |
31.7 |
|
Self-employed |
36 |
7.7 |
14 |
4.5 |
50 |
6.4 |
|
Non-agricultural manual work |
51 |
10.9 |
3 |
1.0 |
54 |
6.9 |
|
Non-agricultural non-manual work |
35 |
7.5 |
4 |
1.3 |
39 |
5.0 |
|
Salaried work |
22 |
4.7 |
3 |
1.0 |
25 |
3.2 |
|
Allied activities in agriculture |
1 |
0.2 |
0 |
0.0 |
1 |
0.1 |
|
Total |
468 |
100.0 |
309 |
100.0 |
777 |
100.0 |
Source: Survey data 2007.
The 2007
survey data reveal an extremely unequal pattern of land ownership in Dongargaon. Landlessness in the village increased sharply
between 1963 and 2007, with the share of landless households rising from 27.7
per cent to 63.6 per cent. Marathas and Kunbis were
seen to be the most dominant landowners in 2007, with 48 per cent of the total
land-holdings in their possession although they constituted only 18.1 per cent
of the population. In contrast, members of the Navbaudh
religious community, who accounted for 28.1 per cent of the population, owned
only 10.2 per cent of the land.
The
sharp rise in landlessness in Dongargaon between 1963
and 2007, as we have argued elsewhere (Ramakumar, Raut, and Kumar 2009), was due to two main
factors. First, the rise in demand for labour
generated by the spread and intensification of cotton cultivation, over a
period, attracted a substantial number of landless Dalit,
Adivasi and VJNT (Vimuktya Jati and Nomadic Tribe) labourers
from outside the village. It is also possible that migration into Dongargaon, and into Akola as a whole, was driven by the
severe and recurrent droughts that affected large parts of Maharashtra in the
early 1970s.
However,
distress migration alone does not explain the significant increase in the Dalit population of the village between the 1960s and 2000s
(ibid.). Among the Dalit households of Dongargaon,
there was a practice of sons-in-law being brought to the village after marriage
and of newly married couples being settled there, rather than daughters being
sent to their marital homes/villages. Dalit men who
married from Dongargaon did not, on the other hand,
move out to their brides’ villages. In interviews with Dalit
elders of the village during the 2007 survey, this was repeatedly and
consistently pointed out as a major reason for the increase in the Dalit population. The readiness with which sons-in-law
moved to Dongargaon was related to the rise in
employment opportunities in and around the village.
The
second important reason for the sharp rise in landlessness in Dongargaon was the increase in the purchase of village land
by persons from outside, due to the spread of cotton cultivation, and due to
the proximity of the village to the National Highway and the MIDC (Maharashtra
Industrial Development Corporation) in Babhulgaon.
This led to a net loss of land-holdings among inhabitants of the village (ibid.).
In terms of employment opportunities in agriculture,
the expansion in the supply of labour in the village has been a major
depressing factor (for historical evidence of this
in
This paper attempts to understand the changes in the
employment available to agricultural labourers in Dongargaon
in the context of these changes in the pattern of labour absorption. Given the
increase in labour supply over the years, what role has been played by the rise
in demand for labour in determining the number of days of employment available
to agricultural labourers? More importantly, are there limits to such an
expansion of employment?
The
Agricultural Work Calendar in Dongargaon
Employment
opportunities in the cultivation of kharif crops in Dongargaon arise in the month of April, when the clearing
and ploughing operations begin (Table 4). Ploughing continues till about the middle of June and then,
once the rains arrive, the sowing operations begin. Thus the peak employment
season for male labourers begins in April and the
peak season for female labourers begins later, in
June. July and August are the months for weeding and fertilizer application.
Cotton-picking and the harvesting of sorghum (jowar) and pulses begin in the month of September and continue till
November. Extension of the kharif harvest season till
November has been due to the introduction of Bt cotton varieties, which involve
a larger number of rounds of picking. Much of the employment generated between
September and November is for female labourers.
From
October onwards, as and when harvesting is completed, shallow ploughing and sowing of the second crop begin in irrigated
plots. All sowings are completed by November. The months of December and
January are set aside for weeding, irrigation, and fertilizer/pesticide
application in the cultivation of wheat, red gram (tur), and vegetables. While wheat and vegetables are harvested in the
month of February, red gram is harvested a little later, in March.
Table 4 Calendar of operations for major crops, by months, Dongargaon, 2006–07
|
Month |
Operations |
Major crops grown |
|
April |
Deep ploughing, shallow
ploughing, clearing the land |
Cotton, sorghum, pulses,
soyabean |
|
May |
Deep ploughing, shallow
ploughing, clearing the land |
Cotton, sorghum, pulses, soyabean |
|
June |
Shallow ploughing, sowing,
fertilizer application, |
Cotton, sorghum, pulses,
soyabean |
|
July |
Hand weeding, animal weeding, fertilizer application |
Cotton, sorghum, pulses, soyabean |
|
August |
Hand weeding, animal weeding, pesticide application |
Cotton, sorghum, pulses, soyabean |
|
September |
Harvesting/picking, threshing |
Cotton, sorghum, pulses, soyabean |
|
October |
Harvesting/picking, threshing (kharif) |
Cotton, sorghum, pulses, soyabean |
|
November |
Harvesting/picking, threshing (kharif) shallow |
Cotton, sorghum, pulses, soyabean |
|
December |
Hand weeding, irrigation, fertilizer application |
Wheat, red gram, vegetables |
|
January |
Hand weeding, irrigation, fertilizer application, |
Wheat, red gram, vegetables |
|
February |
Harvesting, threshing |
Wheat, vegetables |
|
March |
Harvesting, threshing |
Red gram |
Source: Notes taken during the 2007 survey of the village.
Number
of Days of Employment in Agriculture
Classification
of the Working Population
Based on
the 2007 survey, the working population of Dongargaon
may be divided into four broad groups:
(i) workers who are primarily employed as agricultural labourers;
(ii) workers who are primarily employed in non-agricultural manual work
and whose secondary occupation is agricultural labour;
(iii) workers for whom cultivation is the primary occupation and
agricultural labour a secondary occupation;
(iv) workers who are exclusively employed in the non-agricultural
sector.
In the
discussion here of the number of days of employment in agriculture, only the
first three groups of workers are considered for analysis.
Number
of Days of Employment
There
were 317 primary agricultural labourers (group i) in the village in 2007, and their average number of days
of employment in 2006–07 was 111 (Table 5). Thus primary agricultural labourers in Dongargaon were
employed for just about four months a year, on average. This group of labourers was almost completely dependent on agricultural
work, with as much as 94 per cent of their days of employment coming from
agriculture and only 6 per cent from outside agriculture. Agriculture provided
an average of 104 days of employment to a primary agricultural labourer. In other words, the access to non-agricultural
employment for primary agricultural labourers taken
as a whole was limited.
The
difference between male and female primary agricultural workers in terms of the
number of days of employment was marginal. In 2006–07, men were employed for an
average of 118 days and women for an average of 105 days. This difference in
the average number of days of employment between males and females was
accounted for by the days of non-agricultural employment obtained by male
workers. If men obtained an average of 12 days of work in a year in the
non-agricultural sector, the corresponding number of days of such work for
women was only 2. On the other hand, within agriculture, the difference in the
number of days of employment between men and women was small: in 2006–07, men
obtained 106 days and women obtained 103 days of agricultural work.
Table 5 Number of days of employment, primary and secondary agricultural workers, by sector, Dongargaon, 2006–07 in days per year
|
Category |
Agriculture |
Non-agriculture |
Total |
|||
|
Days |
Share (%) |
Days |
Share (%) |
Days |
Share (%) |
|
|
(a) Primary agricultural
labourers (N=317): |
||||||
|
Men |
106 |
89.8 |
12 |
10.2 |
118 |
100.0 |
|
Women |
103 |
98.1 |
2 |
1.9 |
105 |
100.0 |
|
All persons |
104 |
93.7 |
7 |
6.3 |
111 |
100.0 |
|
(b) Secondary agricultural
labourers with daily non-agricultural |
||||||
|
Men |
69 |
39.7 |
105 |
60.3 |
174 |
100.0 |
|
Women |
55 |
47.0 |
62 |
53.0 |
117 |
100.0 |
|
All persons |
65 |
41.1 |
93 |
58.9 |
158 |
100.0 |
|
(c) Secondary agricultural
labourers with cultivation as |
||||||
|
Men |
70 |
85.4 |
12 |
14.6 |
82 |
100.0 |
|
Women |
102 |
100.0 |
0 |
0.0 |
102 |
100.0 |
|
All persons |
83 |
92.2 |
7 |
7.8 |
90 |
100.0 |
Source: Survey data 2007.
For
secondary agricultural labourers with
non-agricultural manual work as their primary occupation (group ii), who were
63 in number in 2006–07, the average number of days of employment in a year was
higher than for primary agricultural labourers, at
158 days. This group of workers was engaged in agriculture for only 41 per cent
of their total number of days of employment; the larger share of their days of
employment (59 per cent or 93 days) came from the non-agricultural sector.3 It was
seen that male labourers in this group obtained a
significantly larger number of days of employment than female labourers; on average, the number of days of employment for
men was 174 days and for women, 117 days. As was the case with the first group,
namely primary agricultural labourers, there was not
much of a difference between men and women in this group in terms of the number
of days of agricultural employment. However, the annual number of days of
non-agricultural employment was significantly higher for men (105 days) as
compared to women (62 days).
For the
third group of workers, those with cultivation as primary occupation and
agricultural labour as secondary occupation, the
average number of days of employment in a year, at 90 days, was the lowest. One
reason for this low figure could be the fact that while the survey collected
worker-wise data for agricultural wage
labour, it did not collect worker-wise data for
family labour in agriculture. The survey data record
only the total number of family labour days, sex-wise, for each operation in each crop. As
a result, the number of days spent on the family farm was not considered while
calculating the total number of days of employment for workers whose primary
occupation was cultivation and secondary occupation was agricultural labour. Yet, what is notable is that for women belonging to
this group of workers, the number of days of employment in agriculture (102
days) was almost the same as for women in the first group of primary
agricultural labourers. The 39 female workers in this
third group put in only a limited number of days of work on the family farm. On
the other hand, male workers in the third group were more involved in family labour than in hired labour;
therefore, in 2006–07, the number of days of employment in agriculture for men
(70 days) was considerably lower than that for women (102 days) in this group.
As noted
above, the average number of days of
agricultural employment for primary agricultural labourers
(group i) in 2006–07 was 106 days for men and 103
days for women. However, roughly half of these male and female agricultural labourers obtained less than 100 days of employment (see
Table 6) during the year, with 49.3 per cent of the men working for less than
100 days and 53.3 per cent of the women working for less than 100 days.
Further, roughly a third of this group of workers – 32.3 per cent of men and
34.5 per cent of women – worked for less than 75 days a year. This goes to show
that underemployment was an important feature of the work profile of
agricultural labourers in Dongargaon
in 2006–07. Lack of access to adequate non-agricultural employment and
in-migration to the village were factors that contributed to the
underemployment.
Table 6 Distribution of workers by size-classes of number of days of employment in agriculture, primary agricultural labourers, Dongargaon, 2006–07 in number and per cent
|
Size-classes of days |
Men |
Women |
||
|
Number |
Share |
Number |
Share |
|
|
Less than 50 |
20 |
13.2 |
20 |
12.1 |
|
50 to 75 |
29 |
19.1 |
37 |
22.4 |
|
75 to 100 |
26 |
17.1 |
31 |
18.8 |
|
100 to 125 |
24 |
15.8 |
23 |
13.9 |
|
125 to 150 |
16 |
10.5 |
25 |
15.2 |
|
150 to 175 |
21 |
13.8 |
15 |
9.1 |
|
175 to 200 |
9 |
5.9 |
6 |
3.6 |
|
More than 200 |
7 |
4.6 |
8 |
4.8 |
|
Total |
152 |
100.0 |
165 |
100.0 |
Source: Survey data 2007.
Number
of Days of Employment by Caste Group
Differences
across caste groups in the average annual number of days of employment, ranging
between 101 and 120 days (Table 7), were not large among male primary agricultural labourers. Dalit male labourers obtained the
largest number of days of employment, at 120 days, followed by OBC males at 118
days and Adivasi males at 116 days. On the other
hand, the number of days of employment for female
agricultural labourers registered wider differences
across caste groups. Adivasi women had the largest
number of days of employment, at 114 days, followed by Dalit
women at 107 days. Women from the VJNT and OBC categories had fewer days of
employment in 2006–07 than Dalit and Adivasi women.
Table 7 Number of days of employment, primary and secondary agricultural workers, by caste and sector, Dongargaon, 2006-07 in days per year
|
Category |
Agriculture |
Non-agriculture |
Total |
|||
|
Men |
Women |
Men |
Women |
Men |
Women |
|
|
(a) Primary agricultural labourers (N=317): |
||||||
|
General (5) |
88 |
55 |
13 |
0 |
101 |
55 |
|
OBC (72) |
108 |
94 |
10 |
0 |
118 |
94 |
|
Dalits (172) |
103 |
104 |
17 |
3 |
120 |
107 |
|
Adivasis (59) |
110 |
112 |
6 |
2 |
116 |
114 |
|
VJNT (9) |
109 |
84 |
0 |
7 |
109 |
91 |
|
All workers (317) |
106 |
103 |
12 |
2 |
118 |
105 |
|
(b) Secondary agricultural labourers with daily
non-agricultural |
||||||
|
General (6) |
66 |
10 |
128 |
0 |
194 |
10 |
|
OBC (10) |
70 |
50 |
40 |
0 |
110 |
50 |
|
Dalits (24) |
51 |
63 |
152 |
30 |
203 |
93 |
|
Adivasis (4) |
72 |
60 |
60 |
125 |
132 |
185 |
|
VJNT (19) |
96 |
70 |
64 |
137 |
160 |
207 |
|
All workers (63) |
69 |
55 |
105 |
62 |
174 |
117 |
Source: Survey data 2007.
The data
relating to primary agricultural labourers contained
in Table 7 are presented in a different format in Figure 1. Here, the plotting
is in terms of the number of days of employment for agricultural labourers by caste group. The figure shows that a
significant proportion of labourers from all caste
groups obtained less than 100 days of employment in 2006–07. Of the major caste
groups, only among Dalits and Adivasis
did more than 50 per cent of the primary agricultural labourers
obtain more than 100 days of employment.
For secondary agricultural labourers from all the caste groups, except for OBCs whose access to non-agricultural employment was relatively limited, the number of days of employment was higher than for primary agricultural labourers (Table 7). Male Dalit secondary agricultural labourers recorded the highest average number of days of employment, 203 days, in 2006–07. Male Dalit labourers also obtained the highest number of days of non-agricultural employment as compared to the other caste groups.4
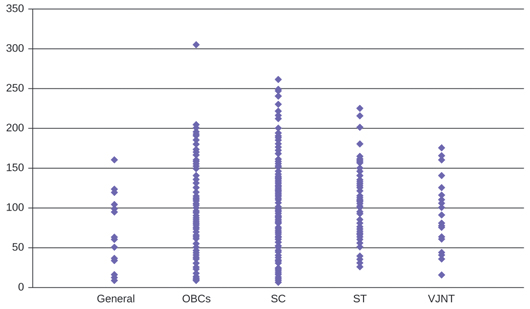
Scatter plot of the number of days of employment in agriculture, primary agricultural labourers, by caste group, Dongargaon, 2006-07 in number
Source: Survey data 2007.
The
women among secondary agricultural labourers worked
in agriculture only during the peak season of cotton/sorghum sowing, cotton
picking, and wheat harvesting, which accounted for roughly two months in the
year. Among them, the VJNT caste group recorded the largest number of days of
employment, 207 days, in 2006–07. For both men and women belonging to the VJNT
group, selling pieces of cutlery in nearby villages was an important form of
non-agricultural employment. The relatively high number of days of
non-agricultural employment among VJNT women reflected this occupational
pattern.
Number
of Days of Employment Across Crops
As noted
earlier, while cotton, sorghum, and wheat were the most important mono-crops
grown in the village, a large area of land was also devoted to inter-crops of
cotton, sorghum, and pulses. During the 2007 survey, it was seen that
agricultural labourers often found it difficult to
precisely identify the crops that were, or would be, grown on the plots on
which they worked. For instance, male agricultural labourers
did not always know if the field they had ploughed would be planted with a mono-crop
or an inter-crop. Even when they knew, the large number of days of employment
provided by cotton, sorghum, pulses, and their inter-crops made it difficult for
them to report the exact number of working days for each of these. This paper
presents crop-wise data on employment wherever available, and aggregates the
rest under inter-crops.
Taken
together, cotton, sorghum, pulses, and their inter-crops accounted for 91 per
cent of the total number of days of employment for men and 88 per cent of days
of employment for women in Dongargaon, in 2006–07
(Table 8). Inter-crops of cotton, sorghum, and pulses provided about half the
average number of days of employment for men and one-third the average number
of days of employment for women. The lower number of days recorded for women
under inter-cropping was due to the fact that they were able to identify the
crops on which they worked more easily. Women were largely occupied in the
sowing and harvesting of specific crops, which they could therefore identify,
as against tasks like ploughing and weeding that were
common across plots. Thus it was seen that about 42 per cent of the average
number of days of employment of female agricultural labourers
were devoted to tasks in cotton cultivation.
Table 8 Average number of days of employment, primary agricultural labourers, by crop, Dongargaon, 2001 in days per year and per cent
|
Crop |
Men |
Women |
||
|
Number of |
Share of |
Number of |
Share of |
|
|
Cotton |
26 |
24.9 |
43 |
41.9 |
|
Sorghum |
17 |
16.1 |
13 |
12.2 |
|
Red gram, black gram |
2 |
1.6 |
3 |
2.5 |
|
Inter-crops: cotton, sorghum, and pulses
|
53 |
49.8 |
35 |
33.5 |
|
Soyabean |
3 |
2.6 |
1 |
1.2 |
|
Wheat |
4 |
4.0 |
1 |
1.3 |
|
Vegetables |
1 |
0.7 |
7 |
6.4 |
|
Other crops |
0 |
0.4 |
1 |
0.9 |
|
All crops |
106 |
100.0 |
103 |
100.0 |
Note: The figures for each crop are normalized to reflect proportions in the overall average.
Source: Survey data 2007.
Cultivation
of crops like wheat and soyabean did not account for
a significant share of the number of days of employment of primary agricultural
labourers (Table 8). This was partly due to the lower
shares of these crops in the gross cropped area, and partly because of the
lower labour absorption in these crops as compared to
crops like cotton.
In Table 9, disaggregated figures are presented for the employment of agricultural labourers in cotton, sorghum, pulses, and their inter-crops
(which together provided 91 per cent of all employment). It will be seen that
the average number of days of employment here (102 for men and 94 for women)
are different from the figures given in Table 5; this is because these averages
are only for cotton, sorghum, pulses, and their inter-crops, and not for all
crops.
Table 9 Number of days of employment obtained in plots in which cotton, sorghum, pulses, and other crops are inter-cropped, primary agricultural labourers, by operation, Dongargaon, 2006–07 in days per year
|
Operation |
Male workers |
Female workers |
||
|
Days |
Share (%) |
Days |
Share (%) |
|
|
Clearing the land |
2 |
2.0 |
5 |
5.3 |
|
Deep ploughing |
15 |
14.7 |
0 |
0.0 |
|
Shallow ploughing |
16 |
15.7 |
0 |
0.0 |
|
Sowing |
8 |
7.8 |
8 |
8.5 |
|
Manure application |
0 |
0.0 |
0 |
0.0 |
|
Fertilizer application |
3 |
2.9 |
6 |
6.4 |
|
Pesticide application |
1 |
1.0 |
0 |
0.0 |
|
Animal weeding |
17 |
16.7 |
0 |
0.0 |
|
Hand weeding |
18 |
17.6 |
35 |
37.2 |
|
Irrigation |
1 |
1.0 |
0 |
0.0 |
|
Harvesting: cotton |
6 |
5.9 |
28 |
29.8 |
|
Harvesting: sorghum |
13 |
12.7 |
9 |
9.6 |
|
Harvesting: red gram |
1 |
1.0 |
0 |
0.0 |
|
Harvesting: other crops |
1 |
1.0 |
3 |
3.2 |
|
All operations |
102 |
100.0 |
94 |
100.0 |
Source: Survey data 2007.
For male
agricultural labourers, deep and shallow ploughing accounted for about 31 per cent, and animal and
hand weeding for about 34 per cent of the average annual number of days of
agricultural employment. Apart from these, the only other agricultural task
that provided substantial employment to male agricultural labourers
was harvesting in sorghum cultivation. Taken together, ploughing,
weeding, and sorghum harvesting accounted for about 77 per cent of their
average number of days of employment.
For
female agricultural labourers, about 67 per cent of
the average number of days of employment came from hand weeding and cotton
picking. Harvesting in sorghum provided 9.6 per cent of the days of employment,
and sowing provided another 8.5 per cent. In other words, the tasks providing
employment to women were less diverse than those for men.
Demand Factors Associated
with Changes in Days of Employment
Since
the study by Joshi (1967) does not provide estimates of the number of days of employment of Dongargaon’s agricultural labourers
in 1964, it has not been possible to quantify the changes in the number of days
of employment in the village between 1963–64 and 2006–07. What Joshi’s study
does provide, however, are estimates of labour
absorption per acre for each crop, as well as an account of the methods of
production in each crop, in 1963–64. Information is also available on the
changes in the larger agrarian economy of Dongargaon
between the 1960s and 2000s.
Based on
the available information, it may be surmised that the average annual number of
days of employment of agricultural labourers in Dongargaon has increased between 1963–64 and 2006–07, due
to the following reasons. First, there has been a spread of irrigation in the
village, which has led to a larger number of crops being grown as well as more
intensive cultivation within each crop. Secondly, changes in the cropping
pattern have been in favour of crops that are more labour-absorbing. Thirdly, changes in the methods of
production have raised the net levels of labour
absorption, especially of women workers. It should be noted, though, that in
spite of the general increase in labour absorption,
the average number of days of employment for agricultural labourers
has not increased beyond four months a year. It would appear that the rise in
the “supply” of labour has stymied increased
availability of employment in the village.
Changes
in Irrigation and Labour Use
In 1963–64,
Dongargaon was primarily a rainfed
village. Only about 16 acres of land, accounting for 3.1 per cent of the net
cropped area, were irrigated (Joshi 1967). As Joshi wrote:
The area is principally a kharif tract. More than ninety per cent of the gross cropped area is under kharif crops. The principal kharif crops are cotton, sorghum, ground nut and red gram. The principal rabi crops are wheat and vegetables. Cotton and sorghum, between themselves, account for about three-fourths of the area. (Ibid., p. 80.)
About 96
per cent of the gross cropped area in Dongargaon was
first-season land in 1963–64 (Table 10), of which 55.2 per cent was cultivated
with sorghum and 33.8 per cent with cotton; sorghum and cotton together accounted
for 89 per cent of the gross cropped area. In the second season, vegetables,
mainly brinjal and onion, were cultivated. According
to Joshi:
The main reason for the infrequency of the rabi crop is on account of the complete absence of irrigation facilities. Whatever irrigation is there is from wells, and naturally, this costly irrigation facility is used for more paying crops like vegetables, fruit crops or sugarcane. (Ibid., p. 80; emphasis added.)
Table 10 Cropping pattern in Dongargaon, 1963 in acres and per cent
|
Crop |
Cultivated
area |
Share
in gross |
Share
of area |
|
1. Kharif and dry crops: |
|||
|
Sorghum |
264.50 |
53.42 |
55.15 |
|
Bajra |
0.25 |
0.05 |
0.05 |
|
Red
gram |
7.87 |
1.59 |
1.64 |
|
Black
gram |
2.20 |
0.44 |
0.46 |
|
Green
gram |
7.12 |
1.44 |
1.48 |
|
Other
pulses |
0.10 |
0.02 |
0.02 |
|
Cotton |
162.05 |
32.73 |
33.79 |
|
Groundnut |
35.50 |
7.17 |
7.40 |
|
All kharif crops |
479.59 |
96.87 |
100.00 |
|
2. Rabi and irrigated crops: |
|||
|
Chilli |
0.21 |
0.04 |
1.38 |
|
Banana |
1.00 |
0.20 |
6.55 |
|
Brinjal |
7.00 |
1.41 |
45.84 |
|
Onion |
3.20 |
0.65 |
20.96 |
|
Other
vegetables |
1.66 |
0.34 |
10.87 |
|
Sugarcane |
1.20 |
0.24 |
7.86 |
|
Wheat |
1.00 |
0.20 |
6.55 |
|
All rabi crops |
15.27 |
3.08 |
100.00 |
|
Gross cropped area |
495.11 |
100.00 |
- |
Source: Joshi (1967).
Crop
rotation (the successive cultivation of different crops in a specified sequence
on the same field) was commonly practised in Dongargaon in 1963. According to Joshi (1967), the most important crops cultivated
in this manner were cotton and sorghum, in cycles of one- or two-year rotation.
In other words, cotton and sorghum were cultivated in turn either every
alternate year, or every two years. On some plots of land, crop rotation
between sorghum and groundnut was also seen.
By 2007,
agriculture in Dongargaon had undergone a total
transformation. The expansion of irrigation, along with technical advances and
the growth of markets, had led to major changes in the types of crops grown,
the number of crops grown each year, and the nature of inter-cropping. The
village was no longer dry and predominantly kharif,
as it was in 1963–64. In 2006–07, of the 534 acres of land owned by inhabitants
of the village, 179 acres (or 33.5 per cent) were irrigated. If only the area
of cultivated land (excluding land left fallow that year) is considered, the
share of irrigated land increases to 40.5 per cent. Expansion of irrigation had
a major impact on the availability of employment in agriculture in Dongargaon, as shown below.
Changes
in Cropping Pattern and Labour Use
Between 1963 and 2007 the cropping
pattern in the village witnessed major changes (see Table 11), although the
major crops continued to be sorghum and cotton in the first season, and wheat
and vegetables in the second season. First, the area under cotton in 2007 was
significantly larger than in 1963, and it exceeded the area under sorghum by a
large margin. Secondly, along with traditional and hybrid varieties of cotton,
Bt cotton was also widely cultivated. Bt cotton was primarily grown as a mono-crop,
though it was sometimes inter-cropped with sorghum and red gram. Thirdly, soyabean had emerged as an important crop cultivated in the
first season. Fourthly, there was a significant growth in the land area devoted
to second-season crops, the most important of which was wheat, followed by
vegetables. In terms of the area under cultivation, wheat had become the third
most important crop in the village. Fifthly, there was a major increase in the
variety of vegetables grown in the second season, alongside a rise in the total
land area under vegetables.
An
important feature of the cropping pattern in Dongargaon
in 2007 was the wide variety of inter-crops. The survey noted the existence of
about 45 different combinations of crops (mono-crops and inter-crops taken together).
A summary of the area under each of these crop combinations is given in Table 11. Mono-cropping of cotton accounted for the single largest share of gross
cropped area, with 32.3 per cent of the cultivated land devoted to solely
cotton/Bt cotton. Cotton was also cultivated as an inter-crop, along with red
gram, sorghum, soyabean, and black gram, in an
additional 9.1 per cent of the gross cropped area. Thus cotton cultivation
accounted for a total of about 41 per cent of the gross cropped area. Sorghum
was the second most important mono-crop, cultivated in 21.7 per cent of the
gross cropped area. It was also cultivated as an inter-crop with red gram,
black gram and green gram, taking the total area under sorghum cultivation up
to about 27 per cent of gross cropped area. Wheat in the second season and soyabean in the first season were the third and fourth most
important mono-crops, in that order.
Table 11 Area under different crops and gross cropped area, Dongargaon, 2006–07 in acres and per cent
|
Crop combinations |
Irrigated area |
Unirrigated area |
Gross cropped area |
|||
|
Area |
Share in |
Area |
Share in |
Area |
Share in |
|
|
Cotton |
30.5 |
11.3 |
156.3 |
39.3 |
186.8 |
27.9 |
|
Bt cotton |
24.0 |
8.9 |
5.0 |
1.3 |
29.0 |
4.3 |
|
Sorghum |
43.5 |
16.1 |
101.3 |
25.4 |
144.8 |
21.7 |
|
Wheat |
99.8 |
36.9 |
4.0 |
1.0 |
103.8 |
15.5 |
|
Cotton + red
gram |
0.0 |
0.0 |
25.0 |
6.3 |
25.0 |
3.7 |
|
Cotton + sorghum
+ red gram |
3.0 |
1.1 |
6.0 |
1.5 |
9.0 |
1.3 |
|
Cotton + red
gram + soyabean |
3.5 |
1.3 |
0.0 |
0.0 |
3.5 |
0.5 |
|
Cotton + black
gram |
0.0 |
0.0 |
3.0 |
0.8 |
3.0 |
0.4 |
|
Bt cotton
+ red gram |
0.0 |
0.0 |
12.0 |
3.0 |
12.0 |
1.8 |
|
Bt cotton
+ sorghum |
4.0 |
1.5 |
0.0 |
0.0 |
4.0 |
0.6 |
|
Cotton + sorghum |
0.0 |
0.0 |
4.0 |
1.0 |
4.0 |
0.6 |
|
Sorghum +
red gram |
1.5 |
0.6 |
9.0 |
2.3 |
10.5 |
1.6 |
|
Sorghum +
black gram |
5.3 |
2.0 |
2.0 |
0.5 |
7.3 |
1.1 |
|
Soyabean |
9.0 |
3.3 |
30.0 |
7.5 |
39.0 |
5.8 |
|
Red gram |
8.5 |
3.1 |
16.1 |
4.1 |
24.6 |
3.7 |
|
Red gram
+ soyabean |
3.6 |
1.3 |
8.0 |
2.0 |
11.6 |
1.7 |
|
Red gram
+ black gram |
0.0 |
0.0 |
4.0 |
1.0 |
4.0 |
0.6 |
|
Black
gram |
2.5 |
0.9 |
5.0 |
1.3 |
7.5 |
1.1 |
|
Green
gram |
1.5 |
0.6 |
2.5 |
0.6 |
4.0 |
0.6 |
|
Cabbage |
3.3 |
1.2 |
0.0 |
0.0 |
3.3 |
0.5 |
|
Others,
including vegetables |
27.1 |
10.0 |
4.8 |
1.2 |
31.8 |
4.8 |
|
Total |
270.5 |
100.0 |
397.9 |
100.0 |
668.3 |
100.0 |
Note: “Cotton” refers to the traditional variety of cotton.
Source: Survey data 2007.
The
changes seen from 1963 to 2007 in the type and combination of crops cultivated
in the village were brought about and deeply influenced by the availability of
irrigation. For instance, by 2007, about 37 per cent of the gross irrigated
cropped area was cultivated with wheat, which was exclusively a second-season
crop. The expansion of wheat cultivation in the second season can be attributed
exclusively to the spread of irrigation. Increased vegetable cultivation in the
second season was also a result of the spread of irrigation; vegetables
occupied 11.2 per cent of the gross irrigated cropped area, as against only 1.2
per cent of the gross non-irrigated cropped area (see Table 11). Annual
cultivation of a larger number of crops was a major feature of the change in
the production environment, which in turn had an effect on the number of days
of employment available to labourers.
Another
important change in cropping pattern brought about by the spread of irrigation
was the opening up of the possibility of cultivating Bt cotton. The higher
yield of Bt cotton, as compared to traditional varieties of cotton, hinged on
the availability of water; the risks were high in cultivating Bt cotton on
non-irrigated land. In 2006–07, about 10.4 per cent of the gross irrigated
cropped area was under Bt cotton, as compared to about 4.3 per cent of the
gross non-irrigated cropped area; in the non-irrigated plots, Bt cotton was
largely inter-cropped with red gram. The spread of Bt cotton, as noted later in
this paper, also led to major changes in labour use
in cotton cultivation.
Changes
in Labour Absorption across Crops
Labour Use in Cotton (Traditional and Hybrid)
Joshi’s study (1967) documents the average annual labour absorption (including hired and family labour) in cotton and sorghum for the year 1963–64.5 The total labour use in sorghum was estimated to be 24 days per acre, and in cotton, 34 days per acre (Table 12). In sorghum, the number of male labour days was higher than the number of female labour days. In cotton, the number of male and female labour days used were almost equal.
Table 12 Labour absorption in different crops, Dongargaon, 1963–64, in number of 8-hour days per acre
|
Operation |
Sorghum |
Cotton |
||
|
Men |
Women |
Men |
Women |
|
|
Preparatory tillage |
5.0 |
2.0 |
8.0 |
2.0 |
|
Sowing |
2.0 |
0.5 |
2.0 |
1.0 |
|
Manuring |
1.0 |
0.5 |
1.0 |
1.0 |
|
Weeding |
2.5 |
3.0 |
6.0 |
11.0 |
|
Harvesting and threshing |
4.0 |
3.5 |
0.5 |
1.5 |
|
Total |
14.5 |
9.5 |
17.5 |
16.5 |
Source: Survey data 2007.
Based on
the 2007 survey data, separate estimates are given here of the number of labour days in 2006–07 for non-Bt cotton, Bt cotton,
sorghum, and a set of typical inter-crops including cotton, sorghum, red gram,
and wheat. The estimates of labour use in non-Bt
cotton, Bt cotton, and sorghum are from plots of land where they were grown as mono-crops.
For each of these crops/crop combinations, separate estimates are also given,
wherever possible, for plots that used machines and plots that used human labour in every operation. Further, the range of labour days used by irrigated and unirrigated
plots for each operation is also presented. Data on family labour
by sex and by operation were collected for all the crops. All the estimates
presented include both hired labour days and family labour days.
Between 1963–64 and 2006–07, the number of labour days used per acre in Dongargaon increased for both cotton and sorghum. On 1 acre of land under cotton, the average number of labour days used in 2006–07, under different conditions, was as follows (see Table 13). Where operations were mechanized with the use of tractors, the number of labour days for unirrigated plots was 57 and for irrigated plots, 99. Where only human/manual labour was used, the number of labour days for unirrigated plots was 61 and for irrigated plots, 103. A common feature in all instances was that the number of female labour days exceeded the number of male labour days by a considerable margin. The division of labour between men and women was clearly laid out: male labour was most commonly used for deep ploughing, shallow ploughing, animal weeding, pesticide application, and irrigation; female labour was most commonly used for sowing, hand weeding, and harvesting.6
Table 13 Labour absorption in non-Bt cotton, Dongargaon, 2006—07 in number of 8-hour days per acre
|
Operation |
Plots using machines |
Plots using bullocks/human labour |
||
|
Men |
Women |
Men |
Women |
|
|
Deep ploughing |
1 |
0 |
4 |
0 |
|
Shallow ploughing |
1 |
0 |
2 |
0 |
|
Sowing |
1 |
4 |
1 |
4 |
|
Animal weeding |
2–6 |
0 |
2–6 |
0 |
|
Hand weeding |
1–3 |
15–20 |
1–3 |
15–20 |
|
Fertilizer application |
0 |
2–3 |
0 |
2–3 |
|
Pesticide application |
1–2 |
0 |
1–2 |
0 |
|
Irrigation |
0–8 |
0 |
0–8 |
0 |
|
Harvesting and transport |
4–10 |
25–40 |
4–10 |
25–40 |
|
Total |
11–32 |
46–67 |
15–36 |
46–67 |
Note: The figures separated by a dash are for non-irrigated and irrigated plots, respectively.
Source: Survey data 2007.
In
cotton cultivation, the operation that accounted for the largest number of labour days was harvesting/picking, followed by hand
weeding. Female labour was predominantly used in both
these operations, leading to a significant rise in the overall level of female labour use in cotton. The spread of cotton cultivation
meant an immediate increase in the demand for female labourers
in picking and hand weeding.
The only
two operations for which machines were used in cotton cultivation were deep and
shallow ploughing. Mechanization of ploughing did not make a significant difference to the
total labour use in cotton, however; the use of
bullocks increased labour use by only about 4 labour days.
It is
clear that labour absorption in cotton rose significantly
between 1963–64 and 2006–07 (see Tables 12 and 13). Joshi (1967) estimated that about 34 labour days were used in cultivating cotton on 1 acre of
land in 1963–64. In 2006–07, on the other hand, even if plots that were mechanized and non-irrigated plots are
taken as a benchmark, the number of labour days was
57 per acre of land. On irrigated land under cotton, the extent of labour use was higher. A comparative study of crop
operations as described in Joshi (1967), and the accounts of peasants belonging to the older
generation as recorded in interviews conducted during the 2007 survey, shows
that there have been several changes in the methods of cultivation in the
village, which have had an effect on labour use.
These were as follows.
First,
one of the most important reasons for the overall increase in labour use in cotton was the rise in labour
use in the picking operation. Between 1963–64 and 2006–07, there was an
increase in the average yield of non-Bt cotton in Dongargaon
from about 1.8 quintals per acre to about 2.8 quintals per acre (Table 14). In
1963–64, owing to lower yield levels, there were just two rounds of pickings in
cotton. The increase in yield led both to more rounds of pickings and to higher
intensity at each picking. As a result, more labour
days went into the picking of cotton in 2006–07, when there were about four to
five rounds of picking even on non-irrigated plots. The larger part of the
overall increase in labour days was accounted for by
female labour days.
Table 14 Average yields of major monocrops, Dongargaon, 1963–64 and 2006–07 in quintals/acre
|
Crop |
Yield in 1963 (in Q) |
Yield in 2007 (in Q) |
|
Sorghum |
3.5 |
7.5 |
|
Cotton |
1.8 |
2.8 |
|
Bt cotton |
- |
6.8 |
|
Red gram |
3.5 |
3.7 |
|
Wheat |
3.5 |
9.0 |
Source: Joshi (1967); survey data 2007.
Secondly,
the area under cotton in the village increased significantly between 1963–64
and 2006–07. And since a unit area of cotton absorbed more labour
days than a unit area of sorghum, there was a corresponding rise in the demand
for labour use.
Thirdly,
the weeding operation in cotton cultivation appears to have gained in
importance between the 1960s and the 2000s. In 1963–64, there were just two
rounds of weeding, one using the dawara (plough) and bullocks, and the other with human labour. In 2006–07, on the other hand, there were two to
three rounds of hand weeding, in addition to one round of animal weeding using
the dawara.
While male workers were employed in animal weeding, a task that could be completed
by them in one day for 1 acre of land, women workers were predominantly
employed in the more labour-intensive task of hand
weeding. The increase in the rounds of hand weeding led to a rise in female labour absorption in cotton cultivation between 1963–64 and
2006–07.
Fourthly,
fertilizers and pesticides were generally not used in cotton cultivation in
1963–64 (Joshi 1967), when
5 to 10 carts of manure per acre of cotton was the only known form of nutrient.
By 2007, however, most of the cotton farmers were using fertilizers and
pesticides, with female workers engaged in the application of fertilizers and
male workers in pesticides. The labour days used in
the application of fertilizers and pesticides in 2007 was larger in number than
the labour days used for applying manure in 1963.
Fifthly,
the increase in spread of irrigation in Dongargaon
between the 1960s and 2000s had a major impact on labour
absorption. The extent of labour use on non-irrigated
and irrigated plots differed. An additional 8 labour
days per acre were used on irrigated land. If there were one or two rounds of
animal weeding and hand weeding on non-irrigated plots, there were at least
three rounds of these operations on irrigated plots. As the yields were higher,
there were also more rounds of picking on irrigated plots than on non-irrigated
plots. Further, as there was a larger quantity of the harvested cotton to be
transported from irrigated plots, the number of labour
days used for transportation was also higher in these.
Sixthly,
a cotton cultivation operation in which there was a decline in labour absorption in 2007 as compared to 1963 was ploughing. In 1963–64, ploughing
was a painstaking operation in the village. Joshi noted that “manuring with 5 to 10 cart loads was a common practice”,
and that “mixing [the manure] and harrowing with 3 to 4 times was followed” (Joshi 1967, p. 93). Interviews
conducted in the village during the 2007 survey revealed that the ploughing operation on plots of hard soil involved just one
round of nangarne
(deep ploughing) followed by one round of mogda (breaking
clods of soil with a long wooden hammer). Thus, as noted by Joshi, whereas 8
male labour days and 2 female labour
days were required to complete the preparatory tillage in 1963–64, in 2006–07
the norm was one round of deep ploughing, largely
with tractors and sometimes with bullocks, followed by one round of shallow ploughing. The task of deep ploughing
on 1 acre of land could be completed by one day of male labour
with tractor or four days of male labour with
bullocks; similarly, one labour day with a tractor or
two labour days with bullocks could complete the task
of shallow ploughing on 1 acre of land. The mogda operation
was not required in 2006–07 because the superior quality of the ploughshares
ensured that very few clods of soil remained after nangarne; and if clods were
present, they were broken by means of a panchi (a heavy, five-blade metal plough used to turn the
land) or a thiree
(a heavy, three-blade metal plough used to turn the land), as a part of the nangarne contract
itself.
In sum,
between the 1960s and 2000s, there was (i) a fall in
the number of male labour days employed in ploughing; (ii) a rise in the number of male labour days used in pesticide application and irrigation
(on irrigated plots); and (iii) a significant rise in the number of female labour days employed in weeding and harvesting.
Labour Use in Bt Cotton
The number of labour days used in the
cultivation of Bt cotton in Dongargaon in 2006–07 are
given in Table 15. Since Bt cotton came to the village only in 2003–04, a
comparison of labour absorption between the years
1963–64 and 2006–07 could be made only for non-Bt cotton cultivation.
By 2006–07,
the introduction of Bt cotton had brought about a significant rise in labour absorption in cotton in the village (Table 15). Even
where machines were used, a non-irrigated plot of Bt cotton accounted for as
many as 143 labour days (38 male and 105 female). On
irrigated plots using machines, the number of labour
days used was higher still, going up to 194. As was the case with non-Bt cotton
cultivation, in Bt cotton, too, the use of machines did not result in a
significant reduction in the level of labour
absorption. Also, much of the difference in the number of labour
days between non-Bt cotton and Bt cotton arose from the increased use of female
rather than male labour in the latter.
Increased
labour absorption in Bt cotton as compared to non-Bt
cotton can be traced to a set of factors. First, Bt cotton had higher yields
than non-Bt cotton, at 6.8 quintals per acre on an average. Higher yields, in
turn, meant more rounds of pickings and the use of a larger number of labour days in each picking. If there were four or five
rounds of picking for non-Bt cotton, Bt cotton allowed for six to seven rounds.
Some farmers in the village began picking in November and continued the
operation till February the next year, with some inter-cropping of vegetables
in the intervening months. The higher yields of Bt cotton also implied that the
labour engaged in the transportation of the produce
after picking was higher.
Table 15 Labour absorption in Bt cotton, Dongargaon, 2006–07 in number of 8-hour days per acre
|
Operation |
Plots using machines |
Plots using bullocks/human labour |
||
|
Men |
Women |
Men |
Women |
|
|
Deep ploughing |
1 |
0 |
4–8 |
0 |
|
Shallow ploughing |
3–2 |
0 |
3–2 |
0 |
|
Row making |
1 |
0 |
1 |
0 |
|
Sowing |
1 |
3–2 |
1 |
3–2 |
|
Animal weeding |
6–4 |
0 |
6–4 |
0 |
|
Hand weeding |
5 |
30–15 |
5 |
30–15 |
|
Fertilizer application |
2–1 |
3–2 |
2–1 |
3–2 |
|
Pesticide application |
3–2 |
0 |
3–2 |
0 |
|
Irrigation |
0–8 |
0 |
0–8 |
0 |
|
Harvesting and
transport |
20 |
60–120 |
20 |
60–120 |
|
Total |
38–49 |
105–145 |
41–56 |
105–145 |
Note: The figures separated by dashes are for non-irrigated and irrigated plots, respectively.
Source: Survey data 2007.
Secondly,
farmers carried out each operation in Bt cotton cultivation with greater care,
as compared to non-Bt cotton. Thus, both for deep ploughing
of plots using only human labour, and for shallow ploughing of plots using human labour
and machines, an additional round of ploughing was
the norm. In both these kinds of ploughing, the
increased labour use was in male labour
days. Similarly, there was an additional round of animal weeding and hand weeding
in Bt cotton plots, as compared to non-Bt cotton plots. Also, additional
amounts of fertilizers and new pesticides were applied in Bt cotton plots,
which again meant use of more labour. While the
additional round of animal weeding raised the use of male labour
days, the additional round of hand weeding and increased fertilizer and
pesticide application raised the use of female labour
days.
Thirdly,
while sowing of non-Bt cotton was undertaken with seed-drills (tiphan), Bt
cotton was sowed manually by placing the seeds by hand on furrows (zari) in the
field. Construction of furrows and manual sowing methods meant that a larger
number of labour days were used in Bt cotton.
In sum,
the shift of land under cotton cultivation from non-Bt cotton to Bt cotton
involved greater labour use, with the increase in the
number of female labour days being larger than the
increase in the number of male labour days.
Labour Use in Sorghum
In plots
where sorghum was grown as a mono-crop, the number of labour
days was smaller than in plots where non-Bt cotton was grown as a mono-crop.
Sorghum was almost exclusively grown in non-irrigated plots. In plots that had
mechanized operations using tractors, the number of labour
days was 37 per acre, while in plots that used human labour
or bullocks, the number of labour days was 40 per
acre (Table 16). A feature of labour absorption in
sorghum cultivation was that, just as in cotton, the female labour
days used was higher than the male labour days.
Table 16 Labour absorption in sorghum, Dongargaon, 2006–07 in number of 8-hour days per acre
|
Operation |
Plots using machines |
Plots using bullocks/human labour |
||
|
Men |
Women |
Men |
Women |
|
|
Deep ploughing |
1 |
0 |
4 |
0 |
|
Shallow ploughing |
2 |
0 |
2 |
0 |
|
Sowing |
2 |
2 |
2 |
2 |
|
Animal weeding |
2 |
0 |
2 |
0 |
|
Hand weeding |
0 |
14 |
0 |
14 |
|
Fertilizer application |
1 |
0 |
1 |
0 |
|
Harvesting |
2 |
6 |
2 |
6 |
|
Threshing |
2 |
3 |
2 |
3 |
|
Total |
12 |
25 |
15 |
25 |
Source: Survey data 2007.
In 1963–64,
the number of labour days used in sorghum was 24 days
per acre, within which the number of male labour days
was 14.5 days. In other words, between the 1960s and 2000s, the share of female
labour days used in sorghum cultivation rose and
surpassed the number of male labour days. The major
changes that took place during this period in the number of labour
days used in sorghum were as follows.
First,
as in cotton, there was a significant rise in the yield of sorghum. Between
1963–64 and 2006–07, the yield per acre of sorghum increased from 3.5 quintals
to 7.5 quintals. The rise in yield, in turn, resulted in a rise in the number
of labour days used in harvesting, threshing, and
transportation. If only 7.5 labour days per acre were
used in the harvesting and threshing of sorghum in 1963–64, the corresponding
figure for 2006–07 was 13 labour days. Further, in
both harvesting and threshing, the predominant labour
days used shifted from male labour days in 1963–64 to
female labour days in 2006–07.
Secondly,
the number of labour days used in weeding increased
between 1963–64 and 2006–07. In the earlier period, there were two rounds of
weeding in sorghum cultivation, both of which were undertaken with the aid of
bullocks and a full-blade hoe (kolpi), and which required the use of two male labour days and three female labour
days per acre. In 2006–07, two rounds of hand weeding were undertaken in
addition to two rounds of animal weeding, and the number of female labour days used in hand weeding alone was 14 per acre.
Thirdly, there was a fall in the number of male labour days used in ploughing, due to the changes that had come about in the nature of preparatory tillage for sorghum, between the 1960s and 2000s. In 1963–64, according to Joshi, “preparatory tillage in sorghum consists of multiple harrowings. Ploughing for sorghum is not a practice in vogue. Two to four harrowings are given after the removal of stalks” (Joshi 1967, p. 92). In 2006–07, preparatory tillage included one round each of deep ploughing (ploughing, as in Joshi) and shallow ploughing (harrowing, as in Joshi).7
Thus,
there was an increase in the total number of labour
days per acre used in sorghum cultivation between 1963–64 and 2006–07. Much of
this increase was accounted for by female labour
days; for men, there was a marginal fall in the number of labour
days used under conditions of mechanization/tractorization.
Labour Use in Inter-crops of
Cotton, Sorghum, and Red Gram
In this
section of the paper on labour use in inter-crops,
only the three major types of inter-cropping seen in Dongargaon
in 2006–07 are considered, namely, cotton–red gram, cotton–sorghum, and sorghum–red
gram. All these crop combinations had the following set of operations in
common: ploughing, sowing, weeding, and fertilizer
application. Considering the labour days across these
operations as common, the differences in labour use
for each crop combination are provided in Table 17.
First,
among the three crop combinations, there was a rise in the labour
days used wherever cotton was involved. Cotton picking is a highly
employment-intensive operation compared to sorghum or red gram harvesting, and
therefore labour absorption was higher when cotton
was a part of the crop combination. Thus, while the total number of labour days in mechanized plots using tractors was 74 per
acre in cotton–red gram and 69 per acre in cotton–sorghum, it was only 33 per
acre in sorghum–red gram. However, in all the crop combinations, the
predominance of female labour days was evident. Here
again, the difference between the number of male and female labour
days was wider where cotton was involved as an inter-crop.
Table 17 Labour absorption in intercrops, Dongargaon, 2006–07 in number of 8-hour days per acre
|
Operation |
Plots using machines |
Plots using bullocks/human labour |
||
|
Men |
Women |
Men |
Women |
|
|
Common operations: |
|
|
|
|
|
Deep ploughing |
1 |
0 |
4 |
0 |
|
Shallow ploughing |
2 |
0 |
2 |
0 |
|
Sowing |
2 |
2 |
2 |
2 |
|
Animal weeding |
2 |
0 |
2 |
0 |
|
Hand weeding |
0 |
14 |
0 |
14 |
|
Fertilizer application |
1 |
0 |
1 |
0 |
|
Specific to cotton + red gram |
|
|
|
|
|
Cotton harvesting |
5 |
35 |
5 |
35 |
|
Red gram harvesting |
2 |
8 |
2 |
8 |
|
Cotton + red gram total |
15 |
59 |
18 |
59 |
|
Specific to cotton + sorghum |
|
|
|
|
|
Harvesting |
5 |
40 |
5 |
40 |
|
Cotton + sorghum total |
13 |
56 |
16 |
56 |
|
Specific to sorghum + red gram |
|
|
|
|
|
Sorghum harvesting |
2 |
4 |
2 |
4 |
|
Red gram harvesting |
3 |
10 |
3 |
10 |
|
Sorghum + red gram total |
13 |
30 |
16 |
30 |
Source: Survey data 2007.
Secondly,
an important aspect of the introduction of red gram into a crop combination was
that red gram harvesting had to be organized separately in February, much after
the harvesting of cotton or sorghum was completed. Thus an additional number of
labour days had to be employed in red gram
harvesting, which raised the total labour absorption
in a crop combination that included red gram. Even within the different crop
combinations that included red gram, there was a variation in the number of labour days employed in red gram harvesting: 10 labour days were used in a cotton–red gram combination and
13 labour days in a sorghum–red gram combination.
This variation was due to the following reasons. In a cotton–red gram
combination, more rows were devoted to cotton as compared to red gram. On the
other hand, in a sorghum–red gram combination, the number of rows devoted to
each crop was more or less equal. As a result, the number of labour days required to harvest red gram separately in
February was higher when cotton was not involved in the crop combination.
Thirdly,
compared to the cultivation of cotton as a mono-crop, the number of labour days employed per acre for a crop combination
including cotton was different. Labour absorption in
a cotton–red gram combination or a cotton–sorghum combination was moderately higher than labour absorption in a mono-crop of non-irrigated cotton,
but significantly lower than labour absorption in a mono-crop of irrigated cotton. In
the comparisons cited above, it was primarily the number of labour
days used in cotton picking, and then the number of labour
days used in weeding, that accounted for the difference. Needless to say, all
the above crop combinations had a significantly
lower labour
absorption than in a mono-crop of Bt cotton.
Labour Use in Wheat
The
spread of second-season wheat cultivation in Dongargaon
was essentially a phenomenon of the late 1980s and after, following the
expansion of irrigation. Irrigation allowed a second crop to be cultivated, and
led to a rise in overall labour absorption and number
of days of employment.
In 1963–64,
the cultivation of wheat in the village was sparse. Further, farmers paid
little attention to its cultivation practices. Joshi
(1967: 94) noted:
Wheat was sown in November and harvested in February without any interculturing or weeding of the plots. Dry wheat was left uncared for till harvest, except the watching of the crop from stray cattle, whereas the irrigated wheat was watered once a week.
However,
the spread of irrigation led to the establishment of wheat as a regular crop
that was cared for like any other first-season crop. In 2006–07, despite the
fact that deep ploughing is generally not undertaken
for second crops, a quick round of deep ploughing was
carried out for wheat in Dongargaon, followed by a
round of shallow ploughing. The sowing of wheat was
largely mechanized, and so were harvesting and threshing. No animal weeding was
undertaken.
In 2006–07,
the number of labour days used in wheat was 35 days per
acre in mechanized plots using tractors and 45 days per acre in plots not using
tractors (Table 18). The number of labour days used
was the highest in the tasks of irrigation and hand weeding. While male labour days predominated in irrigation, female labour days predominated in hand weeding.
Table 18 Labour absorption in wheat, Dongargaon, 2006–07 in number of 8-hour days per acre
|
Operation |
Plots using machines |
Plots using bullocks/human labour |
||
|
Men |
Women |
Men |
Women |
|
|
Deep ploughing |
1 |
0 |
2 |
0 |
|
Shallow ploughing |
1 |
0 |
2 |
0 |
|
Sowing |
1 |
0 |
1 |
2 |
|
Hand weeding |
2 |
10 |
2 |
10 |
|
Fertilizer application |
2 |
1 |
2 |
1 |
|
Irrigation and drainage |
16 |
0 |
16 |
0 |
|
Harvesting and
transport |
1 |
0 |
3 |
4 |
|
Total |
24 |
11 |
28 |
17 |
Source: Survey data 2007.
The use
of machines for ploughing and harvesting operations
in wheat cultivation is a relatively recent phenomenon in Dongargaon.
The tasks that witnessed significant mechanization were harvesting and
threshing. Mechanization reduced the number of labour
days used per acre from 7 days to just 1 day.
In sum,
the emergence of wheat as a second crop significantly raised overall levels of labour absorption and employment availability in the
village between the 1960s and the 2000s. Although mechanization in wheat
cultivation reduced labour absorption, wheat
cultivation continued to be a major source of demand for labour
in the village in 2006–07.
Conclusion
This
paper makes an effort to understand three aspects of labour
use in Dongargaon, a village in the Vidarbha region of Maharashtra. First, it makes an attempt
to estimate the number of days of employment for agricultural labourers in the village. Second, it tries to estimate the
levels of labour absorption in agriculture in the
village. Third, it attempts to document the changes in the nature and extent of
labour absorption in the village.
The Vidarbha region in Maharashtra has a higher incidence of
agricultural labour among the total work force than
in India as a whole. There has been a continuous rise in the share of
agricultural labourers in the work force of the
region, from the colonial period to the post-Independence period. While the
rising share of agricultural labourers has tended to
depress the availability of employment, there has also been a rise in the
demand for labour in the region’s agriculture. In
this paper, an effort is made to understand the availability of employment for
agricultural labourers in the context of changes in
agricultural production conditions between the 1960s and 2000s. Such a
comparative study was facilitated by the availability of data and information
from two surveys of the village: a survey conducted in 1963–64 by V. H. Joshi, and a re-survey
conducted in 2007 as part of a larger study of agrarian relations in
Maharashtra.
In 2006–07, on an average, primary
agricultural labourers in Dongargaon
were employed for about 111 days or about four months. For workers engaged in
non-agricultural work as their primary occupation and agricultural labour as a secondary occupation, the number of days of
employment was higher, at 158 days. Thus
underemployment was a feature of the life of agricultural labourers
in Dongargaon in 2006–07. Lack of access to adequate
non-agricultural employment and massive in-migration of workers into the
village underlined the severity of underemployment.
Cotton
and sorghum were the major crops in the village that provided employment to the
agricultural labourers. Taken together, cotton, sorghum, and their inter-crops, with
pulses, accounted for 91 per cent of the number of days of employment days for
men and 88 per cent for women in 2006–07. For male agricultural labourers, ploughing and weeding provided about 65 per cent of the
average number of days of employment. On the other hand, about 67 per cent of
the average number of days of employment of female labourers
came from hand weeding and cotton picking.
The
paper argues that the aggregate demand for agricultural labour
in Dongargaon increased between 1963–64 and 2006–07.
This argument is based on indirect evidence with respect to changes in the
extent of labour absorption in the cultivation of
different crops. In 1963–64, the total labour use in
sorghum was 24 days and in cotton, 34 days. In 2007, in plots under non-Bt
cotton with mechanized operations, the number of labour
days used was between 57 and 99; whereas in plots using human labour, the range of labour days
used was between 61 and 103. The operation using the largest number of labour days was harvesting/picking, followed by hand
weeding. In both these operations, it was female labour
that was predominantly used, which significantly raised the overall levels of
female labour use in cotton cultivation.
There
were at least four factors that contributed to the overall increase in labour absorption in non-Bt cotton cultivation between 1963–64
and 2006–07. First, there was a rise in labour use in
cotton picking. Secondly, the operation of weeding as a whole increased in
importance, and the rise in the number of rounds of hand weeding led to a
significant rise in female labour absorption.
Thirdly, the number of labour days used in the
application of fertilizers and pesticides in 2007 was more than the number of labour days used in manuring in
1963. Fourthly, the spread of irrigation had a major positive impact on labour absorption.
In
sorghum, too, there was an increase in the number of labour
days per acre between 1963–64 and 2006–07. Much of this increase was in respect
of female labour days; for men, there was a marginal
fall in the number of labour days used under
conditions of tractorization.
Introduction
of Bt cotton into the village in the 2000s led to a significant rise in labour absorption. Increased labour
absorption in Bt cotton as compared to non-Bt cotton varieties can be accounted
for by the following factors. First, Bt cotton had higher yields, which meant
that more labourers were engaged in picking.
Secondly, each operation in Bt cotton cultivation was carried out by farmers in
greater detail. Thirdly, sowing of Bt cotton was undertaken by hand, by
individually placing seeds on furrows.
The
extension of wheat cultivation in the second season in Dongargaon
was a development that followed the spread of irrigation. The emergence of
wheat as a second crop significantly raised the overall levels of labour absorption and employment availability in the
village between the 1960s and the 2000s. Even though the use of tractors in
fields under wheat reduced labour absorption, wheat
cultivation continued to be a major source of demand for labour
in the village in 2006–07.
The data
and analysis presented in this paper show that, in the context of a rising
incidence of agricultural labour in the work force,
increased labour absorption has limits in raising the
number of days of employment. Even at times of a major increase in labour absorption between 1963–64 and 2006–07, the average number of days of
employment in Dongargaon did not rise above 120 days
a year. This was most notable for female agricultural labourers;
despite a sharp rise in female labour absorption
between 1963–64
and 2006–07,
the number of days of employment for female agricultural labourers
was less than that for male agricultural labourers.
In sum, rising landlessness and continuing in-migration have undermined the
potential gains of a rise in labour absorption to labourers.
Acknowledgments: This paper is part of a larger research project on agrarian change in rural Maharashtra. We are grateful to the National Centre for Competence for Research (NCCR North-South), Berne, for supporting this project.
Notes
1 In the contemporary period, Berar region would
include the districts of Buldhana,

2 Between 1961 and 1971, the total population rose by 42.1 per cent and the agricultural labourer population rose by 79.4 per cent. Between 1971 and 1981, the total population rose by 12.9 per cent and the agricultural labourer population by 18.7 per cent. Between 1981 and 1991, the total population rose by 27.6 per cent and the agricultural labourer population by 37.3 per cent. Between 1991 and 2001, the total population rose by 12.7 per cent and the agricultural labourer population rose by 12.5 per cent. (See Ramakumar, Raut, and Kumar 2009.)
3 While agriculture was the predominant provider of employment in Dongargaon in 2006–07, non-agricultural employment supplemented it in many important ways. In all, 184 workers were employed in the non-agricultural sector in 2006–07, in various forms of work. Of these 184 workers, 121 workers (66 per cent) were under daily wage contracts and only 47 workers (26 per cent) were under monthly (salary-based and more permanent) contracts. Of the total number of workers in the non-agricultural sector, about 91 per cent were men. Among the male workers, 37 per cent were employed in construction work and 22 per cent were employed under different wage contracts in industrial firms in the nearby MIDC complex in Babulgaon, about 4 kilometres away from Dongargaon. There were 13 government employees in the village, of whom 12 were men.
4 Among non-agricultural workers receiving daily wages, Dalit workers formed the largest proportion; Dalits accounted for 53 per cent of all workers and 56 per cent of all daily workers, in non-agriculture. Both among construction workers and MIDC labourers, where daily contracts were the rule, Dalits predominated; about 73 per cent of construction workers and 51 per cent of MIDC labourers were Dalits. In most other non-agricultural occupations too, such as among drivers, masons, and hotel waiters, Dalits were the most numerous.
5 Guha (1990) uses
data from Farm Management studies in
6 In Dongargaon, use of contract labour for ploughing or harvesting operations was insignificant. Only six households used contract labour for harvesting in 2006–07; piece-rated labour was more common. For the piece-rated labour and the six instances of contract labour, the employers reported exactly how many men and women had come for work, and such data were accordingly recorded. In the data presented in this paper, the number of labour days reported by the employers has been used for estimations.
7 In Dongargaon, in 2006–07, deep ploughing and shallow ploughing were carried out using both tractors and bullocks. The number of fields that were deep-ploughed with tractors was larger than the number of fields deep-ploughed with bullocks. For shallow ploughing, tractors were used only in large plots and bullocks were more commonly used in the smaller plots. There were five tractors in Dongargaon in 2007, all owned by the three largest landowning Maratha households.
References
| Bamezai, Apurva (2010), “Conditions of Employment and Earnings of Agricultural Labourers in Rural Maharashtra,” M. A. dissertation in Development Studies submitted to the Tata Institute of Social Sciences, Mumbai.
|
|
| Bardhan, Kalpana (1977), “Rural Employment, Wages and Labour
Markets in
|
|
| Guha, Sumit (1990),
“Labour Intensity in Indian Agriculture, 1880–1970: Some Findings,” Economic
and Political Weekly, 29 December, pp. A189–A192.
|
|
| Joshi, V. H. (1967), Dongargaon: A Socio-economic Study,
Research Bulletin, Socio-economic Studies: 4, Department of Agriculture,
|
|
| Mukherjee, Anindita
(1998), “Casual Labour,” in Peter Lanjouw and Nicholas Stern (eds.), Economic Development in Palanpur over Five Decades, Oxford University Press, New Delhi, pp. 431–61.
|
|
| Ramachandran, V. K., and Swaminathan, Madhura (2004), “Prospects for
Rural Employment in Contemporary India,” paper presented at the World
Social Forum, Mumbai.
|
|
| Ramakumar, R., Raut, Karankumar, and Kumar, Awanish (2009), Agrarian
Change in Rural
|
|
| Reddy, C. Rammanohar
(1988), “The Incidence of Agricultural Labourers in
|
Glossary
| Adivasi | Here synonymous with Scheduled Tribes (ST) as defined in the Indian Constitution |
| Berar | Name of a region in the eastern part of the State of
|
| Bt | Bacillus thuringiensis |
| Dalit | Here synonymous with Scheduled Caste |
| dawara | A small, single-blade harrow, whose blade is about six inches long |
| gaothan | The part of a village that is ordinarily used for settlement |
| jowar | Great millet; sorghum; Sorghum bicolour
|
| kharif | Summer/monsoon crop, usually sown in June–July, at the beginning of the south-west monsoon |
| kolpi | A full-blade hoe operated with bullocks by labourers; used in weeding |
| mogda | A ploughing operation that involves breaking soil clods with a long wooden hammer |
| moong | Green gram; Vigna radiate |
| nangarne | Deep ploughing |
| panchi | A ploughing operation that involves a quick turn of the soil using a heavy, five-blade metal plough. This is done primarily to break the big clods that persist even after nangarne, and to level up the field before shallow ploughing begins. |
| rabi | Winter crop, usually sown in October–November |
| thiree | A ploughing operation that involves a quick turn of the soil using a heavy, three-blade metal plough. This is done primarily to break the big clods that persist even after nangarne, and to level up the field before shallow ploughing begins. |
| tiphan | A seed drill used in sowing |
| tur | Red gram; Cajanus cajan
|
| urad | Black gram; Vigna mungo
|
| VJNT | Vimuktya Jati and Nomadic Tribe, as in Maharashtra; in |
| zari | Rows for sowing; furrows |