

ARCHIVE
Vol. 4, No. 2
JULY-DECEMBER, 2014
Research Articles
Research Notes and Statistics
Conference
Interviews
Book Reviews
Cotton Cultivation in India Since the
Green Revolution:
Technology, Policy, and Performance
A. Suresh,* P. Ramasundaram,† Josily Samuel,‡ and Shwetal Wankhade§
*Division of Agricultural Economics, Indian Agricultural Research Institute (IARI), Pusa, New Delhi.
†National Agricultural Innovation Project (NAIP), Pusa, New Delhi.
‡Central Research Institute for Dryland Agriculture (CRIDA), Hyderabad.
§Integrated Research and Action for Development, New Delhi.
Abstract: Distinct phases of technology and policy have distinct effects on agricultural performance. Cotton is a useful case for study in this regard, as its cultivation has been frequently subjected to changes with respect to technology and policy action. The most recent of these is the cultivation of Bt cotton. For purposes of this paper, we have divided the period from 1976 to 2010 into three phases: the early hybrid phase (1976–7 to 1991–2), the late hybrid phase (1992–3 to 2001–2), and the Bt phase (2002–3 to 2009–10). The use of such inputs as human labour, machine power, and fertilizer increased over the early hybrid phase, fell during the late hybrid phase, and increased during the Bt phase. At the national level, yields grew at about 2.3 per cent per year in the early hybrid phase, declined to –2.6 per cent per year in the late hybrid phase, and rose sharply to 12.9 per cent in the Bt phase. These changes had implications for the costs of production and for farm profitability. This paper develops, for the first time, an input price index specific to cotton cultivation in India. The study highlights the role of favourable public policy in realising the potential for higher yields that technological advancement provides. Focusing on the development of Bt varieties, which are suited to low-input regimes and marginal environments, rather than on hybrids can help accelerate the social welfare potential of new technology in cotton cultivation. The public sector can play a greater role and responsibility in such an attempt.
Keywords: Public policy, technology, agriculture, performance, cotton, India.
Introduction
This paper is a study of the performance of cotton cultivation in India over three distinct policy phases from 1976 to the present. It is based on national and State-level data from 1975–6 to 2009–10.1
Cotton provides an excellent example of the interaction between technology and policy, and its effects on the cultivation of a crop. Cotton cultivation in India has witnessed major technological changes over the years. Commercial hybrids were introduced in the late 1960s; large-scale diffusion of this technology (supported by favourable public policy) occurred in the 1970s and 1980s; new constraints emerged thereafter in cotton cultivation; and, most recently, Bt cotton has been introduced. Cotton cultivation has also been affected by post-1991 changes in general economic policy and in the trade regime. To take only a few examples, the following have had a bearing on cotton farming: the Industrial Policy Statements of 1991 and 1996, the National Agricultural Policy (2000), the new seed policy (including the decision to permit the import of seeds under open general license in 1998), the Multi-Fibre Agreement on Agriculture, the Agreement on Textiles and Clothes, and the commitments on intellectual property rights within the framework of the World Trade Organisation (WTO).
Database
For our analysis, we have used cost of cultivation (CoC) data collected by the Directorate of Economics and Statistics (DES), Ministry of Agriculture, Government of India, for the period 1975–6 to 2009–10, for all the major cotton-cultivating States. These States include Andhra Pradesh, Gujarat, Haryana, Karnataka, Madhya Pradesh, Maharashtra, Punjab, Rajasthan, and Tamil Nadu. The Commission for Agricultural Costs and Prices (CACP) provides data on input costs under different heads. The different categories of input costs — Cost A1, A2, B1, B2, C1, C2, C2*, and C3 — have been discussed in detail in Sen and Bhatia (2004). Among these, the two cost concepts (or categories) that are of particular relevance to this paper are Cost A2 and Cost C2.2 Cost A2 is the aggregate of paid-out costs incurred in the cultivation process. Cost C2 is total cost at the farm, and includes the imputed values of family labour, rental value of owned land, rent paid for leased-in land, and interest on the value of owned capital assets. Therefore, while gross value of output minus Cost A2 represents the margin over actual paid-out costs, the difference between the gross value of output and Cost C2 represents the margin over imputed costs as well.
For estimates regarding the gross value of output, two sources of information are relevant: the first are estimates provided by the DES, Ministry of Agriculture, along with the cost of cultivation, and the second are estimates provided by the Central Statistical Organisation (CSO). Of these two data sets, the DES data are more useful for farm-level study than the CSO data, and, in order to maintain consistency for data sources, we have used data from the DES for our estimates. Nevertheless, the actual values of gross output recorded by the CSO and estimated from the cost of cultivation surveys by the DES follow each other closely. The margin between the two narrowed further in the 1990s (Sen and Bhatia 2004). The relevant figures for India were estimated by a weighted average method, the weights being either the area under cotton cultivation or total production. A semi-log model was used to estimate trends in rates of growth.
Phases in Cotton Technology and Policy3
Early Post-Independence Phase
Development efforts with respect to cotton cultivation in India began immediately after Independence. This phase of development can be termed the pre-hybrid phase. The policy focus during this phase was to improve cotton production by means of area expansion, mainly through programmes such as the Grow More Cotton programme and the cotton extension schemes of the early 1950s (Kairon et al. 2000). Technological intervention in cotton cultivation began with the introduction of the All India Coordinated Cotton Improvement Programme (AICCIP) by the Indian Council of Agricultural Research (ICAR) in 1967 (AICCIP 2009). These early programmes began showing results in the early 1970s.
An analysis of changes in input use for the early post-Independence period cannot be carried out here as detailed data from the comparative cost of cultivation series are not available.
Early Hybrid Phase, 1976–7 to 1991–2
A significant outcome of the early research programmes on cotton was the development of hybrids for commercial cultivation.4 The release of intra-hirsutum hybrid cotton H-4 in 1970 paved the way for the hybrid cotton era, a unique era in global cotton history. Subsequently, many superior cotton hybrids, most often of shorter duration than previous varieties, were released for cultivation in India. An important consequence of this development was the emergence of cotton–wheat rotation as the most prominent pattern of cropping in northern India (Ramasundaram et al. 2004). This phase was also associated with initiatives in marketing and on the institutional front, including the establishment of the Intensive Cotton Development Programme (ICDP) in 1971–2 and the Cotton Corporation of India (CCI) in the early 1970s.
In 1971, in order to guarantee minimum prices to growers, the Government of Maharashtra implemented a scheme of monopoly procurement of cotton in the State under the Maharashtra Raw Cotton (Procurement, Processing, and Marketing) Act. It was also during this phase that the Commission for Agricultural Costs and Prices (CACP) began to recommend support prices for basic varieties of cotton such as F-414 and H-777 (medium staple) and H-4 (long staple). The Central Institute of Cotton Research (CICR) in Nagpur, established in 1976, provided new research and development support. These policies had a significant impact on cotton production.
Cost estimates for cotton provided by the Department of Economics and Statistics are available from 1976 onwards. We consider 1976–7 to 1991–2 to have been the early hybrid phase for most Indian States.5 The advantages gained in this phase began to dissipate by the early 1990s, when yields and the profitability of cotton began to decline.
Late Hybrid Phase, 1992–3 to 2001–2
The most significant development during this phase was a change in the roles of the public and private sectors in research, with the private sector emerging as a major contributor to seed and pesticide research. The Government of India began the Cotton Technology Mission at the end of the 1990s. Another major development was the Agreement on Textiles and Clothes (ATC), which came into force in 1995 as part of the WTO agreements. Subsequent reforms on the farm front raised input costs and resulted in a decline in profitability, leading to conditions of distress, especially in rainfed cotton regions (Raghavan, 2008).
During this phase, serious constraints emerged in cotton production on the pest front, mainly because crops were affected by the cotton bollworm. None of the existing varieties of cotton was immune to infestation by this pest, and the heavy application of pesticides — which raised the costs of cultivation, and caused environmental pollution, deteriorating human and animal health, rising pesticide resistance, a resurgence of minor pests, and residues in the food chain — affected cotton cultivation. CICR (1998) reported damages to total production to the tune of 50 per cent because of the cotton bollworm.
These developments set the stage for the introduction of transgenic cotton in India in 2002–3.
Bt Phase, 2002–3 to 2009–10
This phase is characterised by the cultivation of transgenic (Bt) cotton, which could withstand early bollworm attacks on cotton crops. The seeds were developed, introduced, and sold to farmers by private companies. Bt cotton was developed by transgression of the genes of a soil-borne bacterium, Bacillus thuringiensis. The response to this technology by farmers was immediate, and cut across farm sizes, cropping systems and regions.
Production Performance of Cotton in India
Trends in Area under Cultivation, Production, and Yield
Trends in the area under cotton cultivation and in the production and yield of cotton in India since 1970–1 are shown in Figure 1. There was an increase in the yield and production of cotton during the entire period under analysis, with a sharp increase after the introduction of Bt cotton. The yield rose gradually till the end of the 1970s, registered a spike in the 1980s that continued till the early 1990s, and slumped during the subsequent period. The trend of decline reversed sharply in the Bt phase. The yield level, which was about 180 kg/ha in 1980, improved only by another 20 kg in the next 20 years (in 2001–2, the yield level was 200 kg/ha). But the Bt phase saw yields more than double, touching a level as high as 424 kg/ha by the triennium ending (TE) 2009–10.
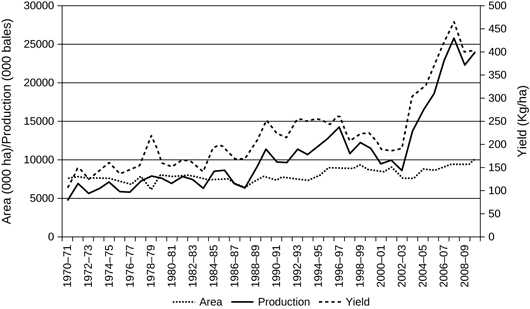
Figure 1 Cotton in India: trends in area, production, and yield, 1970–1 to 2009–10
The trends described here were at the national level. All major States also witnessed a sharp rise in yields in the Bt phase (Table 1). The highest yields were in Punjab and Haryana, where the cotton crop is irrigated. Table 2 presents State-wise data on the growth performance of cotton over the different phases. There was a rise in yield during the early hybrid phase, stagnation or decline during the late hybrid phase, and a spurt during the Bt phase. The use of inputs and the gradual spread of hybrids were responsible for yield growth during the early hybrid phase, while the slump in growth during the late hybrid phase could be because of a reduced use of inputs in the post-liberalisation period, as happened with wheat (Raghavan 2006). Bt technology, which reduced bollworm-induced economic loss, also entailed a high level of input application, causing an improvement in yield realisation during the Bt phase.
Table 1 Trends in the yield of cotton across States, triennium ending (TE) 1978–9 to TE 2001–2 in kg/ha
| States | TE 1978–9 | TE 1991–2 | TE 2001–2 |
| Andhra Pradesh | 132 | 281 | 275 |
| Gujarat | 181 | 224 | 173 |
| Haryana | 332 | 407 | 342 |
| Karnataka | 120 | 225 | 214 |
| Madhya Pradesh | 76 | 102 | 118 |
| Maharashtra | 83 | 110 | 136 |
| Punjab | 350 | 547 | 379 |
| Rajasthan | 218 | 344 | 216 |
| Tamil Nadu | 269 | 289 | 312 |
| All India | 174 | 231 | 200 |
Source: Agricultural Statistics at a Glance, various issues.
Table 2 Trend growth rates of the yield of cotton in selected States, phase-wise, 1978–9 to 2009–10 in per cent per annum
| States | Early hybrid phase (1978–9 to 1991–2) | Late hybrid phase (1992–3 to 2001–2) | Bt phase (2002–3 to 2009–10) | Entire period (1978–9 to 2009–10) |
| Andhra Pradesh | 2.83 | -1.93 | 7.60 | 2.12 |
| Gujarat | 0.87 | 2.36 | 20.63 | 3.17 |
| Haryana | 1.15 | -2.79 | 10.33 | 1.21 |
| Karnataka | 5.64 | 0.29 | 7.35 | 2.84 |
| Madhya Pradesh | 2.69 | 3.11 | 10.93 | 3.40 |
| Maharashtra | 1.62 | 1.06 | 11.68 | 3.41 |
| Punjab | 4.07 | -8.62 | 11.07 | 1.72 |
| Rajasthan | 3.35 | -3.56 | 11.37 | 1.05 |
| Tamil Nadu | 1.62 | 0.21 | 2.58 | 0.36 |
| All India | 2.35 | -2.67 | 12.94 | 2.59 |
Source: Estimated by the authors using data from Agricultural Statistics at a Glance, various issues.
The Bt phase is marked by high yields, high input use, gradual dissipation of yield advantage in the recent period, and the emergence of a new pest complex. Another important feature of the Bt phase is the high level of regional variation in the extent of the benefits realised. The yield advantage is higher in Gujarat, Haryana, and Punjab, where cotton cultivation is mostly irrigated, than in other States. While the irrigated area under cotton is less than one-third of total area at the national level, it is 58 per cent in Gujarat, and close to 100 per cent in Haryana and Punjab. After the introduction of Bt cotton, the irrigation coverage of cotton increased in many States (including Gujarat, Karnataka, and Madhya Pradesh). The rise in irrigation has accelerated the use of other inputs as well.
Trends in Cost of Cultivation
To track the costs of cultivation over a period of time, it is necessary to convert them into real terms using a price index. The Wholesale Price Index (WPI) for all commodities or the Consumer Price Index for Agricultural Labourers (CPIAL) are not satisfactory deflators as they are only remotely related to the index of input prices used in cultivation. We therefore constructed an input price index specific to cotton cultivation. The movement of the cost of cultivation along with the cotton-specific price index is depicted in Figure 2. The figure illustrates a sluggish rise in the cost of cultivation during the early hybrid phase of cotton, a moderate increase thereafter, and acceleration during the Bt phase. The movement of the cost of cultivation is in tandem with the movement of the price indices. The growth in nominal cost of cultivation and the input price index in different phases are provided in Table 3.
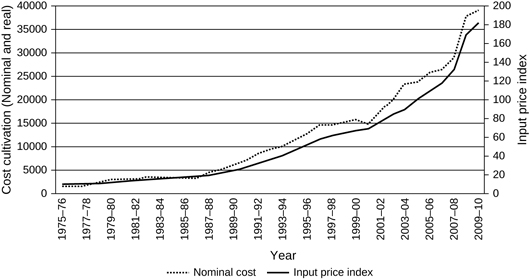
Figure 2 Trends in the cost of cultivation and input price index of cotton in India, 1975–6 to 2009–10 in Rs/ha
Table 3 Growth rates of the cost of cultivation and input price index of cotton in India, phase-wise, 1978–9 to 2009–10 in per cent per annum
| Early hybrid phase (1978–9 to 1991–2) | Late hybrid phase (1992–3 to 2001–2) | Bt phase (2002–3 to 2009–10) | Entire period (1978–9 to 2009–10) | |
| Input price index | 7.81 | 9.06 | 10.85 | 9.41 |
| Nominal cost of cultivation | 8.50 | 7.61 | 9.49 | 9.70 |
| Real cost of cultivation | 0.70 | -1.45 | -1.36 | 0.29 |
Source: Estimated by the authors using data on Cost of Cultivation of Principal Crops, Directorate of Economics and Statistics, Ministry of Agriculture.
During the entire period under consideration, the rate of growth of the nominal cost of cultivation was 9.7 per cent and the growth rate of the input price index was 9.41 per cent, indicating a growth rate of the real cost of cultivation of 0.29 per cent per year. The highest growth rate of the cost of cultivation and of input prices was during the Bt phase..
Table 4 shows, for selected States, changes in the real and nominal cost of cultivation at four points of time, along with the corresponding growth rate of real cost.6 At the all-India level, the cost of cultivation increased from Rs 1,856/ha in 1978–9 to Rs 35,275 in 2009–10, a rate of 9.7 per cent per year. There were distinct differences across the phases. The high regional variations are also noteworthy. Notwithstanding some variations, the rate of growth of the cost of cultivation was high in the early hybrid phase, declined during the late hybrid phase, and increased again during the Bt phase. During the Bt phase, the rates of growth of the costs of cultivation were highest in Gujarat, Haryana, and Madhya Pradesh. The costs of cultivation in Tamil Nadu declined during this phase.
Table 4 Changes in the cost of cultivation of cotton, selected States, triennium ending (TE) 1978–9 to TE 2009–10 in Rs/ha and per cent per annum
| States | Nominal cost (Rs/ha) | Real cost (Rs/ha) | Trend growth rate of real cost (per cent) | |||||||||
| 1978–9 | 1991–2 | 2001–2 | 2009–10 | 1978–9 | 1991–2 | 2001–2 | 2009–10 | Early hybrid phase | Late hybrid phase | Bt phase | Overall | |
| Andhra Pradesh | 5945 | 8847 | 20560 | 42565 | 52555 | 28007 | 26329 | 25898 | 1.36 | 7.50 | 6.85 | 8.38 |
| Gujarat | 2044 | 7899 | 14024 | 37825 | 19324 | 24497 | 18982 | 26450 | 7.16 | 5.38 | 13.61 | 8.10 |
| Haryana | 2380 | 6319 | 17875 | 42605 | 20575 | 21866 | 21466 | 24766 | 6.30 | 9.42 | 12.90 | 10.11 |
| Karnataka | 1170 | 5612 | 10807 | 20929 | 10378 | 13943 | 11919 | 12300 | 9.04 | 6.39 | 10.19 | 7.20 |
| Madhya Pradesh | 1817+ | 6133 | 9668 | 27955 | 24474+ | 21721 | 13349 | 20012 | 17.31 | 4.13 | 12.11 | 10.94 |
| Maharashtra | 963 | 5979 | 15573 | 31113 | 19842 | 23637 | 20813 | 21567 | 13.36 | 9.75 | 7.02 | 11.82 |
| Punjab | 2353 | 9802 | 23615 | 48130 | 27614 | 37141 | 32256 | 29630 | 11.33 | 6.90 | 8.58 | 10.56 |
| Rajasthan | – | 11328++ | 13961 | 28621 | – | 18610++ | 16316 | 18056 | – | 4.89 | 10.21 | 6.21 |
| Tamil Nadu | 3580 | 11983 | 29114 | 38995 | 38823 | 37917 | 35377 | 24734 | 9.53 | 8.50 | 1.79 | 8.93 |
| All India | 1856 | 7138 | 16037 | 35275 | 22308 | 25239 | 21609 | 23850 | 9.84 | 7.63 | 9.49 | 9.70 |
Notes:1. Each reference here indicates the average for the
triennium ending with that reference year.
2. + and ++ indicate the
average values for the triennium ending 1983–4 for Madhya Pradesh and 1996–7
for Rajasthan, respectively, as data are available for these States only from
1981–2 and 1994–5 onwards. For Madhya Pradesh, period II is 1981–2 to1983–4;
for Rajasthan, period II is 1994–5 to 1996–7.
3. Real values are calculated by deflating nominal values with constant input
prices of cotton cultivation for the year 2004-5 and then estimating
triennium-ending averages.
4.
For estimation of compound growth rates, the various phases are as follows: Early
hybrid phase: 1978–9 to 1991–2; late hybrid phase: 1992–3 to 2001–2; Bt phase:
2002–3 to 2009–10; overall: 1978–9 to 2009–10. In the case of Madhya Pradesh
and Rajasthan, the early hybrid phase refers to the period 1983–4 to 1991–2,
and the overall period refers to 1983–4 to 2009–10. For Rajasthan, the early
hybrid phase is not considered due to unavailability of data, and the late
hybrid phase refers to the period 1996–7 to 2001–2. Accordingly, the overall
period refers to 1996–7 to 2009–10. Growth rates are based on triennium-ending
average data to minimise the impact of fluctuations.
Source: Commission for Agricultural Costs and Prices (CACP) Reports, various issues.
Trends in the Cost of Production
Trends in the cost of production — the cost of producing a unit quantity of output — reflect the net effect of two factors, namely, cost of cultivation and per-hectare yield. In nominal terms, the cost of production increased everywhere till the end of the late hybrid phase, and varied over the Bt phase (Table 5). However, in real terms, at the national level, the cost of production declined throughout. This trend was also pervasive across States, except during the late hybrid phase, when the cost of production increased in five out of nine States. These aberrations were mainly due to increases in the cost of cultivation combined with relatively low rates of growth of yield. In the Bt phase, there was a reduction across the board in the real cost of production. The decline in the real cost of production during the early hybrid phase was supported by the faster spread of better-yielding hybrids and American cotton, and a favourable input price regime. On the other hand, the post-1991 period indicated a mixed pattern, one of increasing costs of production in the late hybrid phase and a reversal of this trend in the Bt phase.
Table 5 Changes in the cost of production of cotton, selected States, triennium ending (TE) 1978–9 to TE 2009–10 in Rs/quintal and per cent per annum
| States | Nominal Cost (Rs/quintal) | Real Cost (Rs/quintal) | Trend growth rate of real cost (in per cent) | |||||||||
| 1978–9 | 1991–2 | 2001–2 | 2009–10 | 1978–9 | 1991–2 | 2001–2 | 2009–10 | Early hybrid phase | Late hybrid phase | Bt phase | Entire period | |
| Andhra Pradesh | 455 | 1036 | 1763 | 2205 | 4075 | 3563 | 2285 | 1332 | 6.71 | 5.78 | 3.28 | 5.86 |
| Gujarat | 447 | 741 | 2317 | 2040 | 4638 | 2441 | 3229 | 1455 | 5.12 | 11.35 | –1.30 | 6.01 |
| Haryana | 298 | 505 | 2551 | 2139 | 2752 | 1803 | 3246 | 1292 | 3.16 | 16.16 | –3.74 | 8.16 |
| Karnataka | 280 | 985 | 2298 | 2065 | 2709 | 2076 | 2643 | 1240 | 9.36 | 7.33 | –0.93 | 7.72 |
| Madhya Pradesh | 388 | 1055 | 2607 | 1905 | 5373 | 3757 | 3739 | 1428 | 15.06 | 8.61 | –6.00 | 7.93 |
| Maharashtra | 271 | 874 | 2126 | 2407 | 5755 | 3748 | 2927 | 1718 | 7.71 | 8.83 | 0.09 | 7.54 |
| Punjab | 266 | 722 | 2303 | 2061 | 3237 | 2829 | 3309 | 1334 | 6.14 | 14.88 | –3.44 | 8.31 |
| Rajasthan | – | 808 | 993 | 1734 | – | 1506 | 1419 | 1143 | – | 5.47 | 2.07 | 4.92 |
| Tamil Nadu | 360 | 888 | 2559 | 2274 | 4011 | 3028 | 3215 | 1493 | 9.53 | 8.50 | 1.79 | 8.93 |
| All India | 341 | 804 | 2076 | 2150 | 4256 | 3026 | 2755 | 1489 | 5.90 | 9.47 | –0.79 | 7.02 |
Source: Estimated by the authors using data on Cost of Cultivation of Principal Crops, DES, Ministry of Agriculture.
Some observations emerge from these trends (Table 6). At the national level, during the early hybrid phase, though the increase in the cost of cultivation was about 285 per cent, a yield increase of about 33 per cent limited the increase in the cost of production to 136 per cent. There was a sharp reversal of this trend in the late hybrid phase. During this period, input costs increased by 125 per cent coupled with a decline in yield of 13 per cent, resulting in an increase in the costs of production of 158 per cent. From this analysis it is clear that farm income growth suffered in the late hybrid phase because of two major factors: a secular decline in cotton yield, and rising input prices that were not compensated by output price growth despite repeated increases in the minimum support price (MSP).
As noted earlier, a major reason for the yield decline was an increase in pest attacks, although it might also be reflective of deeper systemic factors. However, the spurt in yield by about 112 per cent limited the increase in cost of production by about 4 per cent, even while the cost of cultivation registered a 120 per cent increase. Thus, the introduction of Bt cotton helped to overcome some of the negative fall-out of the late hybrid phase by increasing the value of output through yield improvement.
Table 6 Changes in selected indicators of costs, prices, and output of cotton in India, triennium ending (TE) 1978–9 to TE 2009–10 in Rs/ha, kg/ha, Rs/quintal, and per cent per annum
| All India | Triennial average (prices in nominal terms) | Percentage change during: | ||||||||||||
| 1978–9 | 1991–2 | 2001–2 | 2009–10 | Early hybrid phase | Late hybrid phase | Bt phase | ||||||||
| Cost of cultivation (Rs/ha) | 1856 | 7138 | 16037 | 35275 | 285 | 125 | 120 | |||||||
| Yield (Kg/ha) | 174 | 231 | 200 | 424 | 33 | –13 | 112 | |||||||
| Cost of production (Rs/quintal) | 341 | 804 | 2076 | 2150 | 136 | 158 | 4 | |||||||
| Value of output (Rs/ha) | 2351 | 9749 | 15903 | 44400 | 315 | 63 | 179 | |||||||
| Farm harvest price of kapas (Rs/quintal) | 379 | 850 | 1889 | 2606 | 124 | 122 | 38 | |||||||
Note: Kapas is plucked cotton from which seeds and lint have not been separated.
Source: Estimated by the authors from data in the reports of the Commission for Agricultural Costs and Prices (CACP).
Trends in Input Use and Costs
Relationship between fixed and variable costs
Agricultural economists need to pay attention to trends in farm income realisation for different crops. Though the cost of cultivation does not reflect trends in farm income, the relationship between fixed and operational cost components is indicative of the trend. As per the methodology used in the surveys of the costs of cultivation of principal crops conducted by the Department of Economics and Statistics, Ministry of Agriculture (henceforth referred to as the CCPC surveys), land rent is calculated as a fixed proportion of the gross value of output (GVO). Land rent is the major component of fixed cost. Because of this methodological feature, it turns out that an increase in the share of fixed cost in the cost of cultivation is indicative of improved farm income. At the all-India level, the fixed cost amounted to close to one-third of the cost of cultivation in 1978–9; it increased marginally during the early hybrid phase, fell sharply during the late hybrid phase, and rose again in the Bt phase (Table 7).
Another major component of fixed cost is interest on fixed assets. The behaviour of this component is ascertained on the basis of the actual assets created by farmers. These are in turn a function not only of current profitability, but also of expected future profits. Therefore, the interest on fixed assets might behave independently of rent on owned land and the general trend in fixed costs. A decline in the share of fixed costs in the late hybrid phase occurred in all States (barring Tamil Nadu). However, this trend was reversed during the Bt phase at the all-India level and in most States — a clear indication of the revival in the prospects of cotton cultivation.
Punjab is a good example of this interesting change in cost composition. It exhibited the sharpest changes in fixed costs, by 10 and 15 percentage points, during the early hybrid and Bt phases. However, there was a 17 percentage point decline during the late hybrid phase and a 15 percentage-point increase in the Bt phase. From the early hybrid phase to the late hybrid phase, there was an increase in pest attacks and disease. However, new technology turned the situation around in the Bt phase.7
Table 7 Share of fixed cost in the total cost of cultivation of cotton, selected States, 1978–9 to 2009–10 in per cent
| States | 1978–9 | 1991–2 | 2001–2 | 2009–10 |
| Andhra Pradesh | 39.85 | 41.00 | 37.55 | 39.23 |
| Gujarat | 24.02 | 27.02 | 22.72 | 30.70 |
| Haryana | 35.13 | 34.36 | 32.94 | 34.75 |
| Karnataka | 39.84 | 33.49 | 27.16 | 32.44 |
| Madhya Pradesh | 46.14 | 40.88 | 34.33 | 41.42 |
| Maharashtra | 36.17 | 35.56 | 25.90 | 28.51 |
| Punjab | 37.24 | 47.30 | 30.50 | 45.30 |
| Rajasthan | – | 40.02 | 34.43 | 35.95 |
| Tamil Nadu | 38.66 | 35.81 | 37.96 | 22.66 |
| All India | 33.86 | 36.51 | 29.33 | 33.51 |
Source: Estimated by the authors from data in the reports of the Commission for Agricultural Costs and Prices (CACP).
Trends in Variable Input Use and Cost Changes
Seed
In official cost of cultivation surveys, the cost of seed includes the value of farm-saved, freely-exchanged, and purchased seeds. Cotton is a crop in which the seed system has undergone significant changes over the past half century. Till the advent of hybrids, cotton cultivation was undertaken with a minimum quantity of market-sourced seeds. But the introduction of hybrids triggered a change, and the seed system in cotton gradually came under the dominance of the private sector. Still, the use of farm-saved and exchanged seeds continued to play a major role in cotton varieties, notably in the irrigated north Indian cotton belt where hybrid cultivation was near-absent till the introduction of Bt cotton. The Bt gene was transferred in hybrids and was marketed by Mahyco-Monsanto Biotech, the proprietary patent holder of the Bt gene. It is worth mentioning here that India is the only major cotton-producing country in the world to have the Bt gene cultivated only through hybrids rather than varieties (Ramasundaram et al. 2011).
These changes had a significant influence on the use of cotton seeds (Table 8). The technological change in cotton resulted in the progressive reduction of the quantity of seed used. At the all-India level, the quantity of seed used declined from 11 kg/ha in the early hybrid phase to 7 kg/ha in the late hybrid phase, and further to 3 kg/ha in the Bt phase. This trend was observed across States. Official cost of cultivation data do not provide explicit information on variety-wise changes in the cost of cultivation. However, with the transition from varieties to hybrids, per-hectare seed use declined by about 50 per cent in Punjab.8
Table 8 Levels and costs of seed use, and share of seed cost to operational cost of cotton, selected States, triennium ending (TE) 1978–9 to TE 2009–10 in kg/ha, Rs/ha, and per cent
| States | Quantity (kg/ha) | Cost (Rs/ha) | Share of seed cost in operational cost (per cent) | |||||||||
| 1978–9 | 1991–2 | 2001–2 | 2009–10 | 1978–9 | 1991–2 | 2001–2 | 2009–10 | 1978–9 | 1991–2 | 2001–2 | 2009–10 | |
| Andhra Pradesh | 6 | 4 | 5 | 2 | 184 | 417 | 1377 | 2483 | 5.16 | 7.99 | 10.73 | 9.60 |
| Gujarat | 12 | 6 | 6 | 2 | 129 | 303 | 799 | 2168 | 8.28 | 5.26 | 7.37 | 8.27 |
| Haryana | 15 | 13 | 13 | 3 | 45 | 149 | 387 | 2949 | 2.90 | 3.58 | 3.23 | 10.61 |
| Karnataka | 9 | 6 | 8 | 3 | 35 | 346 | 678 | 2039 | 5.02 | 9.27 | 8.61 | 14.42 |
| Madhya Pradesh | 15 | 6 | 4 | 1 | 101 | 273 | 554 | 2041 | 10.36 | 7.52 | 8.73 | 12.46 |
| Maharashtra | 10 | 6 | 4 | 2 | 42 | 327 | 980 | 2199 | 6.87 | 8.48 | 8.49 | 9.89 |
| Punjab | 13 | 19 | 14 | 3 | 34 | 163 | 625 | 3621 | 2.33 | 3.16 | 3.81 | 13.75 |
| Rajasthan | – | 15 | 16 | 13 | – | 355 | 482 | 1412 | – | 5.23 | 5.26 | 7.70 |
| Tamil Nadu | 20 | 13 | 10 | 6 | 108 | 213 | 574 | 1778 | 4.91 | 2.77 | 3.18 | 5.89 |
| All India | 11 | 8 | 7 | 3 | 75 | 297 | 851 | 2298 | 6.07 | 6.55 | 7.51 | 9.80 |
Source: Estimated by the authors from data in the reports of the Commission for Agricultural Costs and Prices (CACP).
These changes in the seed sector have had a significant effect on seed costs. At the all-India level, seed costs increased over the years in nominal terms, with a sharp rise after the introduction of Bt. The share of seed cost in operational cost remained almost stagnant, at about 6 per cent, till 1991, increased to 7.5 per cent by 2002, and escalated to 10 per cent by 2009–10. The trend at State levels was in tandem with the national trend. The increase in seed costs in the post-reform period, notwithstanding heavy competition, can be attributed to rents due to intellectual property rights in the seed sector. Bt seed-producing companies extract monopoly profits. The exorbitant cost of Bt seeds led to stealthy marketing of Bt seeds, farmers’ unrest, and subsequent government interventions to regulate the seed market in many States.
Labour use
One of the most important indicators of technological change in cotton cultivation is the change in the composition of labour use (Sen and Bhatia 2004). Official cost of cultivation studies take three kinds of labour into account: human labour, animal/bullock labour (power), and machine labour (power).9 The use of each of these three kinds of labour is determined by their availability, relative prices, and elasticity of substitution. One can reasonably anticipate that an economic transition will entail a substitution of human and animal labour by machine labour. With regard to the relationship between human and animal labour, the increased use of animal labour entails an increase in the use of human labour as well (because of the complementary relation between the two) while also displacing human labour from certain agricultural operations, particularly land preparation (Raghavan 2008).
Human labour
The use of manual labour in cotton cultivation exhibits some interesting trends over the years (see Table 9). Cotton cultivation at the national level absorbed about 90 person-days per hectare during the late 1970s; that figure increased to over 100 by 1991–2. Although the late hybrid phase saw a decline of 7 person-days per hectare,10 there was a rise of 16 person-days per hectare in the Bt phase. Labour use varied substantially across States: for the triennium ending 2010, it ranged from 74 person-days per hectare in Madhya Pradesh to 144 person-days per hectare in Gujarat.
The data show an increase in the use of human labour in the Bt phase at a rate of 1.5 per cent per year, as compared to negative growth of –1.7 per cent in the preceding phase. The pattern was almost uniform across all the major States (albeit with minor variations). The increase in labour use during the early hybrid phase was mostly due to increasing crop yield, which might have absorbed more labour for harvesting the increased output. The same factors were also in operation, although in the opposite direction, during the late hybrid phase, when cotton yields plummeted. By contrast, all States barring three posted an increase in labour use in the Bt phase; the sharpest increase was in Gujarat, which also recorded a sharp yield increase. In Andhra Pradesh and Tamil Nadu, labour absorption actually declined in the Bt phase, by 20 per cent and 10 per cent respectively.
Table 9 Number of person-days of human labour used, costs of human labour use, and share of human labour cost in operational cost, cotton, selected States, 1978–9 to 2009–10 in person-days/ha, Rs/ha, and per cent
| States | Human labour (person-days/ha) | Cost (Rs/ha) | Share in operational cost (per cent) | |||||||||
| 1978–9 | 1991–2 | 2001–2 | 2009–10 | 1978–9 | 1991–2 | 2001–2 | 2009–10 | 1978–9 | 1991–2 | 2001–2 | 2009–10 | |
| Andhra Pradesh | 176.0 | 97.6 | 99.9 | 90.3 | 693 | 1800 | 5237 | 12720 | 19.38 | 34.49 | 40.79 | 49.17 |
| Gujarat | 91.4 | 115.0 | 87.9 | 144.1 | 417 | 2108 | 4407 | 11641 | 26.83 | 36.58 | 40.66 | 44.41 |
| Haryana | 84.5 | 81.9 | 83.8 | 98.3 | 761 | 1911 | 7185 | 15325 | 49.29 | 46.06 | 59.94 | 55.12 |
| Karnataka | 59.3 | 91.0 | 90.4 | 87.1 | 249 | 1354 | 3263 | 6185 | 35.38 | 36.28 | 41.46 | 43.74 |
| Madhya Pradesh | 60.8 | 86.8 | 51.3 | 74.4 | 297 | 1573 | 2667 | 7040 | 30.37 | 43.38 | 42.00 | 42.99 |
| Maharashtra | 74.4 | 95.3 | 103.3 | 105.5 | 253 | 1476 | 4375 | 7940 | 41.25 | 38.30 | 37.91 | 35.70 |
| Punjab | 100.8 | 101.9 | 88.1 | 93.1 | 759 | 2397 | 5869 | 12809 | 51.41 | 46.39 | 35.76 | 48.65 |
| Rajasthan | – | 67.4 | 66.0 | 81.6 | – | 3351 | 4889 | 10369 | – | 49.32 | 53.41 | 56.56 |
| Tamil Nadu | 167.1 | 193.8 | 176.0 | 139.6 | 659 | 4618 | 11549 | 17520 | 30.00 | 60.04 | 63.94 | 58.09 |
| All India | 89.5 | 100.8 | 93.0 | 108.8 | 407 | 1835 | 4765 | 10267 | 33.15 | 40.47 | 42.05 | 43.77 |
Source: Estimated by the authors from data in the reports of the Commission for Agricultural Costs and Prices (CACP).
The cost implications of changing labour use are shown in Table 9. In 2009–10, human labour was the single largest component of cost, accounting for about 44 per cent of the total cost of cultivation. There was an overall increase in the share of human labour over time, notably in the late hybrid and Bt phases. In the early hybrid and Bt phases, there was a rise in actual labour use and the share of labour in total cost. In the late hybrid phase, however, there was a reduction in labour use but a rise in cost share on account of either increasing wage rates or a more than proportional reduction in the use of other inputs, or both.
The total wage component as reported in official cost of cultivation data consists of wages actually paid to casual and permanently attached labourers, and family labour. Family labour is the major form of labour used on the farms of small farmers; its share in total labour use generally declines as farm size increases. In India, a long-term decline in farm size and growing marginalisation have added to the number of small farms (Chand et al. 2011), which generally use more family labour than others. During the 1970s and 1980s, wages for family labour were imputed at the same wage rates as wages for attached labourers, which were generally lower than wages of casual labourers. Subsequent replacement of casual wage as the basis for imputation may have had an impact on the wage share of family labour in the total cost of cultivation. However, even after the upward revision in imputed wages for family labour, an increase of 16 per cent in labour use was associated with an increase of only 1.5 per cent points in wage share during the Bt phase.
Labour with animals (bullock power) and labour with machines
The share of labour with draught animals in operational cost varied between 12 and 15 per cent in all three phases at the all-India level. However, there was a strikingly high regional variation in this share, with Karnataka, Madhya Pradesh, and Maharashtra generally exhibiting higher shares than other States. In the official cost of cultivation surveys, the use of machine labour is not reported in physical terms. This limits inter-temporal and inter-spatial comparisons of machine labour use. We circumvented this problem by examining real costs. In the case of machine labour, the trend was quite conspicuously that of a reduction in the real cost in the Bt phase, as compared to a sustained increase during the early hybrid and late hybrid phases. Such a decline in the Bt phase was recorded in four States.
Increasing bullock labour costs in some States and a decline in machine labour costs (in real terms) point to a rising unit cost of machine labour-hours. This rise is most evident in the case of Punjab. In the late hybrid phase, the share of machine labour in operational cost in Punjab increased by 7 percentage points and the share of bullock labour decreased by 2 percentage points, whereas in the subsequent Bt phase, the share of bullock labour registered a mild increase and there was a reduction of 2 percentage points in the share of machine labour. The general conclusion that can be drawn from this discussion is that the usage of machine labour did not exhibit any particular robust trend. More clarity on this aspect can be gained only through an in-depth analysis of labour scarcity during peak agricultural seasons and of the decline of the draught animal population.
Fertilizer
The use of chemical fertilizers in cotton cultivation increased over the entire period, from 44 kg to 158 kg per hectare (see Table 10). The overall growth rate of fertilizer application was 2.6 per cent per year, with each phase depicting distinct trends (Table 11) and the Bt phase showing a sharp rise in fertilizer use. The growth rate of fertilizer use was about 2 per cent per year during the early hybrid phase, 0.7 per cent during the late hybrid phase, and 8.1 per cent during the Bt phase. These broad trends were observed in all States.
Table 10 Levels and costs of fertilizer use, and share of fertilizer cost in total operational cost of cotton, selected States, triennium ending (TE) 1978–9 to TE 2009–10 in kg/ha, Rs/ha, and per cent
| States | Quantity (kg nutrients/ha) | Cost (Rs/ha) | Share of fertilizer cost in total operational cost (per cent) | |||||||||
| 1978–9 | 1991–2 | 2001–2 | 2009–10 | 1978–9 | 1991–2 | 2001–2 | 2009–10 | 1978–9 | 1991–2 | 2001–2 | 2009–10 | |
| Andhra Pradesh | 186 | 109 | 132 | 225 | 729 | 826 | 1625 | 3079 | 20.4 | 15.8 | 12.7 | 11.9 |
| Gujarat | 54 | 111 | 74 | 172 | 185 | 691 | 886 | 2310 | 11.9 | 12.0 | 8.2 | 8.8 |
| Haryana | 28 | 87 | 62 | 130 | 126 | 497 | 701 | 1682 | 8.2 | 12.0 | 5.9 | 6.1 |
| Karnataka | 30 | 69 | 70 | 107 | 127 | 507 | 925 | 1594 | 18.0 | 13.6 | 11.8 | 11.3 |
| Madhya Pradesh | 23 | 87 | 71 | 111 | 116 | 545 | 899 | 1508 | 11.9 | 15.0 | 14.2 | 9.2 |
| Maharashtra | 19 | 66 | 107 | 138 | 72 | 524 | 1408 | 2067 | 11.8 | 13.6 | 12.2 | 9.3 |
| Punjab | 42 | 108 | 71 | 177 | 158 | 564 | 799 | 2181 | 10.7 | 10.9 | 4.9 | 8.3 |
| Rajasthan | – | 53 | 103 | 117 | – | 503 | 1104 | 1649 | – | 7.4 | 12.1 | 9.0 |
| Tamil Nadu | 84 | 127 | 156 | 265 | 269 | 951 | 1875 | 3767 | 12.2 | 12.4 | 10.4 | 12.5 |
| All India | 44 | 87 | 95 | 158 | 165 | 596 | 1184 | 2204 | 13.4 | 13.2 | 10.5 | 9.4 |
Source: Estimated by the authors from data in the reports of the Commission for Agricultural Costs and Prices (CACP).
Table 11 Growth rates of fertilizer use in cotton, selected States, phase-wise, 1978–9 to 2009–10 in per cent per annum
| States | Early hybrid phase | Late hybrid phase | Bt phase | Overall |
| Andhra Pradesh | 0.06 | 7.23 | 5.39 | 7.22 |
| Gujarat | –0.31 | –4.89 | 13.97 | 0.38 |
| Haryana | 7.63 | –3.92 | 14.95 | 4.12 |
| Karnataka | 0.69 | 0.03 | 11.77 | 0.42 |
| Madhya Pradesh | 22.49 | –1.11 | 7.64 | 4.76 |
| Maharashtra | 8.18 | 4.28 | 4.33 | 4.93 |
| Punjab | 8.20 | –6.03 | 13.30 | 3.76 |
| Rajasthan | – | 16.88 | 3.17 | 2.49 |
| Tamil Nadu | 2.00 | 0.18 | 8.39 | 3.23 |
| All India | 1.97 | 0.70 | 8.06 | 2.58 |
Source: Estimated by the authors from data in the reports of the Commission for Agricultural Costs and Prices (CACP).
Farmers generally increase fertilizer application in the belief that it will lead to an increase in yield, particularly in combination with irrigation. This trend, which was marked during the early hybrid phase when fertilizer use doubled in cotton cultivation, slowed down during the late hybrid phase. A simple analysis indicates that, in the early hybrid phase, nutrient application increased by 97 per cent at a cost increase of 261 per cent, whereas in the late hybrid phase, only a 9 per cent increase occurred in nutrient use, but at a cost increase of 98 per cent. Eliminating the effects of length of time-period, this implies that while the cost increase per unit nutrient increase was 2.6 in the early hybrid phase, it was 11 in the late hybrid phase.
One noteworthy feature of the late hybrid phase is that fertilizer application in Punjab — a State characterised by the highest fertilizer use — decreased to below the national average. However, during the Bt phase, fertilizer use in Punjab increased 150 per cent in just eight years.
During the Bt phase, fertilizer use increased at the national level and across States, barring a few exceptions.
Insecticides
As mentioned earlier, Bt cotton was introduced as a response to increasing pest attacks and a high level of use of insecticides. A careful observation of the data (Table 12) indicates that the costs of insecticide application increased continuously till the end of the late hybrid phase, with wide variations across States, but reduced marginally during the Bt phase. In the case of Punjab, by 2001–2, insecticide costs accounted for more than one-third of the total operational cost. The introduction of Bt cotton contained this growth and even reduced it in some States, for example, in Andhra Pradesh and Punjab. Since the physical quantity of insecticides applied in the fields is not recorded in the official cost of cultivation surveys, we have used constant prices to provide a better insight into changes in insecticide use. At the national level, during the early hybrid phase, the expenditure on insecticides increased (on a real cost basis) in seven out of the nine States studied. The trend continued in the late hybrid phase. In the Bt phase, there was a decline in costs at the national level and in six out of the same nine States. It is also noteworthy that as a share of operational costs, insecticide costs declined continuously, from 16 per cent in the late 1970s to 6 per cent in 2009–10, with the sharpest decline occurring in the Bt phase.
Table 12 Levels and costs of insecticide use, and share of insecticide cost in operational cost of cotton, selected States, triennium ending (TE) 1978–9 to TE 2009–10 in kg/ha, Rs/ha, and per cent
| States | Cost (Rs/ha) | Cost (Rs/ha, at constant prices) | Share of insecticide cost in operational cost (per cent) | |||||||||
| 1978–9 | 1991–2 | 2001–2 | 2009–10 | 1978–9 | 1991–2 | 2001–2 | 2009–10 | 1978–9 | 1991–2 | 2001–2 | 2009–10 | |
| Andhra Pradesh | 1268 | 1087 | 2051 | 1749 | 6966 | 2233 | 2268 | 1393 | 35.5 | 20.8 | 16.0 | 6.8 |
| Gujarat | 240 | 715 | 986 | 1956 | 1315 | 1484 | 1085 | 1547 | 15.5 | 12.4 | 9.1 | 7.5 |
| Haryana | 57 | 604 | 1359 | 1814 | 314 | 1220 | 1492 | 1436 | 3.7 | 14.6 | 11.3 | 6.5 |
| Karnataka | 106 | 422 | 623 | 693 | 580 | 876 | 690 | 545 | 15.1 | 11.3 | 7.9 | 4.9 |
| Madhya Pradesh | 11 | 348 | 245 | 1171 | 38 | 720 | 268 | 926 | 1.1 | 9.6 | 3.9 | 7.2 |
| Maharashtra | 22 | 320 | 655 | 877 | 123 | 656 | 727 | 690 | 3.6 | 8.3 | 5.7 | 3.9 |
| Punjab | 61 | 959 | 5548 | 2438 | 335 | 1964 | 6087 | 1928 | 4.1 | 18.6 | 33.8 | 9.3 |
| Rajasthan | – | 1065 | 1239 | 1507 | – | 1233 | 1371 | 1199 | – | 15.7 | 13.5 | 8.2 |
| Tamil Nadu | 620 | 480 | 724 | 1065 | 3406 | 988 | 795 | 840 | 28.2 | 6.2 | 4.0 | 3.5 |
| All India | 192 | 553 | 1242 | 1437 | 1051 | 1136 | 1368 | 1137 | 15.6 | 12.2 | 11.0 | 6.1 |
Source: Estimated by the authors from data in the reports of the Commission for Agricultural Costs and Prices (CACP).
Trends in Farm Business Income and Profitability
Farm business income (FBI), which is the difference between the Gross Value of Output (GVO) and paid-out costs, is an indicator of the economic sustainability of agriculture. However, while considering a single crop, profitability — that is, GVO relative to cost — is often a more useful concept. For a comprehensive view, we have analysed profitability with respect to two cost concepts — Cost A2 and Cost C2. While a comparison of GVO with Cost A2 indicates farm profitability with respect to paid-out costs, a comparison with Cost C2 shows output relative to total costs including imputed values of land and capital.
Table 13 illustrates the trend in the value of output per hectare and the ratio of the value of output with respect to both Cost A2 and Cost C2. The ratio of GVO to Cost A2 went from 2.3 at the start of the early hybrid phase to 2.2 by the end of it, and further to 1.68 by the end of the late hybrid phase. This indicates that while a 125 per cent increase in cost yielded a 139 per cent increase in GVO during the early hybrid phase, the corresponding figures for the late hybrid phase were a 115 per cent increase in cost for a 63 per cent increase in GVO. In terms of Cost C2, the ratio fell dramatically, and by 2001–2, it was below one. During the late hybrid phase, cotton cultivation was generating profits when considered in relation to Cost A2 but not when reckoned against Cost C2. However, this slump was overcome during the Bt phase, when the ratios improved to 2.24 in the case of Cost A2 and 1.26 in the case of Cost C2. The pattern in the States closely followed the national pattern.
There was thus a sharp change in the responsiveness of the value of output with respect to costs incurred. To examine this change, we estimated the cost elasticity of output (Table 14).
Table 13 Levels of value of output and ratio of value of output to cost in cotton cultivation, selected States, 1978–9 to 2009–10 in Rs/ha
| States | Value of output (Rs/ha) | Ratio of value of output with respect to paid-out cost (Cost A2) | Ratio of value of output with respect to total cost (Cost C2) | |||||||||
| 1978–9 | 1991–2 | 2001–2 | 2009–10 | 1978–9 | 1991–2 | 2001–2 | 2009–10 | 1978–9 | 1991–2 | 2001–2 | 2009–10 | |
| Andhra Pradesh | 7084 | 11107 | 22618 | 50750 | 1.96 | – | 1.85 | 2.10 | 1.19 | 1.26 | 1.10 | 1.19 |
| Gujarat | 2212 | 9677 | 12844 | 53586 | 2.22 | 2.49 | 1.45 | 2.51 | 1.08 | 1.23 | 0.92 | 1.42 |
| Haryana | 3167 | 10624 | 23871 | 54527 | – | 4.03 | 3.79 | 3.04 | 1.33 | 1.68 | 1.34 | 1.28 |
| Karnataka | 1676 | 7431 | 9545 | 26624 | 3.72 | – | 1.39 | 2.13 | 1.43 | 1.32 | 0.88 | 1.27 |
| Madhya Pradesh | 2444 | 7032 | 9031 | 37010 | 2.70 | – | 1.99 | 2.79 | 1.35 | 1.15 | 0.93 | 1.32 |
| Maharashtra | 1607 | 8938 | 14284 | 34160 | 2.77 | – | 1.39 | 1.71 | 1.67 | 1.49 | 0.92 | 1.10 |
| Punjab | 2347 | 13856 | 19365 | 62345 | – | 2.92 | 1.39 | 2.68 | 1.00 | 1.41 | 0.82 | 1.30 |
| Rajasthan | – | 21509 | 19979 | 46718 | – | 4.79 | 3.08 | 4.57 | – | 1.90 | 1.43 | 1.63 |
| Tamil Nadu | 4843 | 14104 | 24115 | 44796 | 2.29 | – | 1.92 | 2.12 | 1.35 | 1.18 | 0.83 | 1.15 |
| All India | 2351 | 9749 | 15903 | 44400 | 2.33 | 2.22 | 1.68 | 2.24 | 1.27 | 1.37 | 0.99 | 1.26 |
Source: Estimated by the authors from data in the reports of the Commission for Agricultural Costs and Prices (CACP).
It is evident from Table 14 that, at the national level, the elasticity of output (value) with respect to cost declined from 1.11 in the early hybrid phase to 0.51 by the late hybrid phase, and it increased to 1.49 in the Bt phase, an increase of about 190 per cent. Two important conclusions emerge from this. First, the input cost responsiveness of output was lower in the period immediately following the reforms as compared to the previous period. This could be due to high input prices leading to subdued input demand, and a consequent decline in yield realisation. Increased pest attacks could be one reason for subdued yield, but the available literature suggests that the pest effect could not have been of this magnitude. Another factor could be the less-than-proportionate increase in output prices, which resulted in a lower gross value of output.
Secondly, the Bt phase witnessed a reversal of this trend, both at the national level and in all States. The extent of change was highest in Punjab and lowest in Andhra Pradesh. To explain the increase in the gross value of output, two factors are examined more closely, namely, the extent of technological change manifested in changes in yield, and the price of output. The relevant output prices in this context are Farm Harvest Prices (FHP), as they reflect the prices realised by farmers.
Table 14 Elasticity of value of output to Cost C2 in cotton cultivation, selected States, phase-wise, 1978–9 to 2009–10
| States | Early hybrid phase | Late hybrid phase | Bt phase |
| Andhra Pradesh | 1.16 | 0.78 | 1.16 |
| Gujarat | 1.18 | 0.42 | 1.87 |
| Haryana | 1.42 | 0.68 | 0.93 |
| Karnataka | 0.90 | 0.31 | 1.91 |
| Madhya Pradesh | 0.79 | 0.49 | 1.64 |
| Maharashtra | 0.88 | 0.37 | 1.39 |
| Punjab | 1.55 | 0.28 | 2.14 |
| Rajasthan | – | –0.31 | 1.27 |
| Tamil Nadu | 0.81 | 0.50 | 2.53 |
| All India | 1.11 | 0.51 | 1.49 |
Source: Estimated by the authors from data in the reports of the Commission for Agricultural Costs and Prices (CACP).
To recapitulate our discussion on yield, the yield of cotton increased during the early hybrid phase, declined during the late hybrid phase, and rose again during the Bt phase; this trend was seen across the board in all States (see Table 2). It is also noteworthy that the price of kapas, (plucked cotton from which seeds and lint have not been separated) witnessed a general increase during all the phases. When this information is read together with the data in Table 15, it can be inferred that the late hybrid phase was characterised by an average yield reduction to the tune of 2.7 per cent per year at the national level, coupled with an increase in farm harvest prices at the rate of 12.9 per cent per year. On the other hand, the Bt phase was characterised by a 14 per cent yield increase per year, coupled with an increase in FHP that was close to 4 per cent per year. Clearly, it was the lower output of cotton that resulted in lower gross values of output in the late hybrid phase, while it was high output growth that was mainly responsible for higher value realisation in the Bt phase.
Table 15 Levels of farm harvest prices of cotton, selected States, triennium ending (TE) 1978–9 to TE 2009–10 in Rs/quintal
| States | Farm harvest price (Rs/quintal, kapas) | |||
| 1978–9 | 1991–2 | 2001–2 | 2009–10 | |
| Andhra Pradesh | 423 | 1048 | 1926 | 2597 |
| Gujarat | 387 | 1140 | 1671 | 2573 |
| Haryana | 395 | 803 | 1999 | 2699 |
| Karnataka | 349 | 855 | 1960 | 2574 |
| Madhya Pradesh | 386 | 1031 | 1876 | 2718 |
| Maharashtra | 324 | 659 | 1994 | 2073 |
| Punjab | 372 | 788 | 1963 | 2966 |
| Rajasthan | 725 | 994 | 1689 | 2781 |
| Tamil Nadu | 388 | 759 | 1662 | 2646 |
| All India | 379 | 850 | 1889 | 2606 |
Source: Estimated by the authors using reports on Farm Harvest Prices in India, DES, Ministry of Agriculture.
Recent Concerns
Recent trends indicate that the input cost of Bt cotton cultivation is increasing at the all-India level. The cost of production is also gradually increasing in many States. Both these trends have raised serious questions regarding the sustainability of Bt technology. Further, input productivity, which rose with the introduction of Bt, is showing a gradual decline, especially with regard to fertilizer. Figure 3 illustrates the movement of partial fertilizer productivity, defined as the output per unit of fertilizer applied, at the national level and in three major cotton-producing States, Andhra Pradesh, Gujarat, and Maharashtra, since 1990–1. Partial productivity at the national level declined gradually up to the early 2000s, and then rose with the introduction of Bt, peaking by 2004–5, after which it declined again. This trend was broadly similar at the State level, most visibly in Gujarat. This suggests that the effect of the new technology was eroded by higher input application.
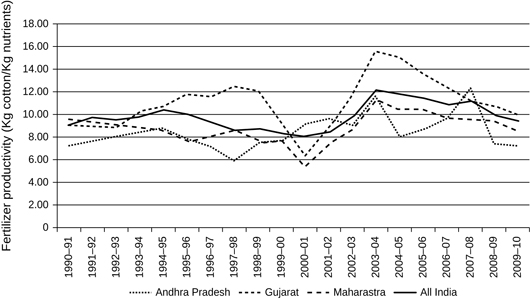
Figure 3 Trends in fertilizer productivity of cotton, selected States, 1990–1 to 2009–10 in kg of cotton per kg of nutrients
The discussion above raises important questions regarding Bt cotton technology in India. While the innovativeness of Bt cotton rests on the introduction of the Bt gene, in India it was introduced to the field through hybrids. Notably, though hybrids in cotton were available in the country from the 1970 onwards, they covered only one-third of the total area under cotton in 2000. The rest of the area was occupied by varieties, which had distinct advantages over hybrids for certain geographical areas and sections of society in terms of agro-climatic suitability, input requirements, and so on. The Bt gene was introduced in certain hybrids by private companies, compelling farmers to purchase seeds every year. The proprietary patent holders of the gene extract rents over the patent rights, thereby raising the seed cost. With the introduction of Bt technology in hybrids and its fast diffusion, more than 90 per cent of the area under cotton came under hybrids. This indicates that the demand was for the Bt gene rather than for hybrids. With the spread of Bt hybrids, many popular varieties were eliminated from cultivation (Ramasundaram et al. 2011).
Summary and Conclusions
The analysis brings forth some significant conclusions.
- The cost of cultivation increased consistently over all the phases of cotton cultivation. The rise was moderate during the early hybrid phase and accelerated in subsequent phases. The increase continued through the post-reform period, with a sharp rise after 2001–2, coinciding with the introduction of Bt cotton. The increase in the cost of cultivation was particularly pronounced in fixed costs during the pre-reform period, and this trend was reversed in the late hybrid phase (immediately after 1991). However, it rose faster than operational cost during the Bt phase, indicating a trend of rising gross values of output, as fixed cost is aligned with the gross value of output.
- In nominal terms, the cost of production of cotton rose till the end of the late hybrid phase, and declined in the Bt phase. Despite the increase in the cost of cultivation, the large yield enhancement during the Bt phase was enough to arrest an increase in the cost of production.
- Input use has undergone distinct changes in different phases. In physical terms, at the national level, the seed rate has gone down consistently. The use of human labour, machine power, and fertilizer increased in the early hybrid phase. This was followed by a slump in the late hybrid phase and a rise in the Bt phase. With respect to insecticides, the Bt phase was characterised by a reduction in real cost compared to the previous phase. The decline in input use during the late hybrid phase might be attributed to systemic factors in the aftermath of economic liberalisation. This led to a reduction in yield and low growth of the gross value of output, bringing distress to cotton-farming communities. The high occurrence of pest attacks exacerbated the situation. The revival during the Bt phase was mainly on account of the positive effects of technology supported by favourable public policy, notably on the institutional credit front.
- The elasticity of value of output with respect to cost declined in most States and at the national level during the late hybrid phase, and increased sharply in the Bt phase. The sharp reversal was mainly on account of changes in yield.
- The impact of Bt technology has weakened, as shown by the reduction in partial productivity of fertilizers and an increase in the costs of production. Moreover, a resurgence of minor pests has been reported. The spread of Bt cotton brought about a spread of hybrids, and was associated with changes in the use of inputs such as fertilizer, labour, and irrigation. The enhanced application of inputs also contributed to productivity improvement in areas of less intensive cultivation. The use of Bt technology reduced losses through control of the cotton bollworm.
Thus it is evident, from the contrasting performance of cotton during various phases, that technology and policies have played a decisive role in determining the performance of the cotton crop. The technological advantage of Bt cotton seems to have been augmented by higher input application. One major reason for this is that the technology has spread through hybrids. Modifying this technology so as to make it suitable for a low-input-use regime along with policies that ensure favourable terms of trade would further augment farm profitability, and prolong the sustainability of the technology across farm sizes and agro-systems. Developing Bt varieties is an important step in this direction. The public sector can and must play a greater role in this regard. In the long term, our strategy with respect to cotton cultivation needs to expand the yield frontier further, while at the same time including the use of a more sustainable (and proportionately smaller) set of crop inputs.
Acknowledgements: This study was undertaken as a part of the project “Visioning, Policy Analysis and Gender,” at the National Centre for Agricultural Economics and Policy Research (NCAP), New Delhi, with the financial support of the National Agricultural Innovation Project (NAIP) of the Indian Council of Agricultural Research (ICAR), New Delhi. The authors thank Professor Ramesh Chand, Director, NCAP, for his useful suggestions during the course of the study. The authors are responsible for any errors in the paper. The views expressed here are of the authors and not necessarily of the organisations to which they belong.
Notes
1 Cost of cultivation (CoC) is the cost incurred in cultivation per unit area (usually measured in rupees per hectare), whereas cost of production (CoP) is the cost incurred in production per unit quantity of output (usually measured in rupees per quintal). Thus, CoP = (CoC per hectare ÷ yield per hectare), if the value of by-product/s is negligible.

2 By the conventions followed by the Government of India, the components of Cost A2 and Cost C2 are as follows: Cost A2 includes the value of purchased material inputs (seed, insecticides and pesticides, manure, fertilizer), hired human labour, animal labour (hired and owned), hired farm machinery, depreciation on farm implements and farm buildings, irrigation charges, land revenue cesses and other taxes, interest on working capital, and rent paid for leased-in land. Cost C2 includes all the components of Cost A2 plus the imputed value of family labour, interest on the value of owned capital assets (excluding land), the rental value of owned land (net of land revenue), and rent paid for leased-in land.
3 A detailed description of the various phases of cotton cultivation can be obtained from Suresh et al. (2013).
4 A “variety” is a pure inbred line and its seeds can be reused for cultivation for three to four seasons without any significant loss of vigour. A “hybrid” is developed through a cross between parents that are genetically unlike — different genera, species, or varieties. The resulting seed (F1) then produces plants that exhibit hybrid vigour or heterosis only in the first generation, and the hybrid vigour is largely lost in the second generation. This means that the seed of hybrid varieties has to be replaced in order to maintain hybrid advantage. Because of this characteristic of hybrids, the farmer cannot reuse the seed material produced at his farm.
5 For Madhya Pradesh, data were available from 1981–2 onwards, and therefore the early hybrid phase was considered to have started from that year. In the case of Rajasthan, where cotton is cultivated under irrigated conditions, data are available from 1994–5 onwards (that is, data for the first phase are not available).
6 Real prices were arrived at using a constant input price for 2004–5.
7 With regard to Haryana, Punjab, and Rajasthan, the terms “early hybrid” and “late hybrid” are used only to maintain uniformity in terminology at the all-India and State levels. In these three States, the share of hybrid cultivation was less than 5 per cent till the introduction of Bt cotton.
8 The Bt gene was transgressed only in hybrids as far as India is concerned, not in varieties. In Punjab and other irrigated States, cotton cultivation was dominated by varieties till the introduction of Bt cotton. With the adoption of Bt cotton, varieties were displaced by hybrids.
9 We use the conventional term “labour” to denote human labour power as well as animal- and machine-power.
10 Labour-hours were converted into person-days by using the standard conversion: 8 labour-hours equal one person-day.
References
| Agricultural
Statistics at a Glance,
Directorate of Economics and Statistics, Ministry of Agriculture, Government of
India, various issues.
|
|
| Commission
for Agricultural Costs and Prices (CACP) Reports, Ministry of Agriculture,
Government of India, New Delhi, various issues.
|
|
| All India Coordinated Cotton
Improvement Programme (2003), Annual
Report, Central Institute of Cotton Research Regional Station, Coimbatore.
|
|
| Chand, R., Prasanna, P. A. L., and Singh, A. (2011), “Farm Size and Productivity: Understanding the Strengths of Smallholders and Improving Their Livelihoods,” Economic and Political Weekly, vol. 46, no. 2, Jun, pp. 5–11.
|
|
| Kairon, M. S., Ramasundaram, P., and
Venugopalan, M. V. (2000), “Cotton Production: Agenda for Action in New
Millennium,” Survey of Indian Agriculture,
The Hindu, Chennai, pp. 109–12.
|
|
| Raghavan, M. (2008), “Changing Pattern of Input Use and Cost of Cultivation,” Economic and Political Weekly, vol. 28, no. 26-27, Jun, pp. 123–9.
|
|
| Ramasundaram,
P., Sabesh, M., Shende, N. V., and Gajbye, H. L. (2004), “Contribution of
Hybrids to Cotton Productivity,” Hybrid Cotton Newsletter, Central
Institute for Cotton Research, vol. 12, no. 1, p. 3.
|
|
| Ramasundaram, P., Suresh, A., and Chand, Ramesh
(2011), “Manipulating Technology for Surplus Extraction: The Case of Bt Cotton in India,” Economic
and Political Weekly, vol. 46, no. 43, Oct, pp. 23–6.
|
|
| Sen, Abhijit, and Bhatia, M. S. (2004), State
of the Indian Farmer: A Millennium Study, vol. 14, Cost of Cultivation and Farm Income, Academic
Publishers, New Delhi.
|
|
| Shah, Tushar, Gulati, A., Hemant, P.,
Sreedhar, G., and Jain, R. C. (2009), “Secret of Gujarat’s Agrarian Miracle
after 2000,” Economic and Political
Weekly, vol. 44, Dec, pp. 45–55.
|
|
| Suresh, A., Ramasundaram, P., Samuel,
S., and Wankhade S. (2013), “Impact of Technology and Policy on Growth and Instability
of Agricultural Production: The Case of Cotton in India,” Indian Journal of Agricultural Sciences, vol. 83, no. 8, pp.
939–48.
|