

ARCHIVE
Vol. 7, No. 2
JULY-DECEMBER, 2017
Introduction
Research Articles
Research Notes and Statistics
Review Articles
Book Reviews
Wage Rates in Rural India, 1998–99 to 2016–17
Arindam Das∗ and Yoshifumi Usami†
∗Senior Programme Manager, Foundation for Agrarian Studies, arindam@fas.org.in
†Research Fellow, University of Tokyo, yoshiusami@gmail.com
Abstract: This article revises and updates the agricultural and rural labour wage rate series compiled in Usami (2012) and examines trends in real wage rates in rural areas in India over the last two decades. The data in this article are compiled from the Wage Rates in Rural India (WRRI) reported in the Indian Labour Journal, a monthly publication of the Labour Bureau, Government of India. The data for the agricultural year 2016–17 are now available, and allow us to study recent trends in agricultural and rural labour wage rates. The reliability of published WRRI data are checked using unit-level data that are collected for the WRRI by the Field Operations Division of the National Sample Survey Organisation (NSSO). Based on the updated series, we examine State-wise and all-India trends in the growth of wage rates, and find a clear division into two sub-periods. The first sub-period, from 1998–99 to 2006–7 was a period of stagnation, while the second sub-period, from 2007–8 to 2014–15 was a period of rapid growth in wage rates. However, the steady growth in wage rates of major occupations ended in 2015-16, recovering marginally during 2016–17. A change in definition of occupations in November 2013 makes it difficult to compare trends after 2013 with those before.
Keywords: agricultural labour, rural labour, wage rates, WRRI, NSSO, unit data, India, trends in wage rates, rural occupations
Introduction
This article revises and updates the agricultural and rural labour wage rate series compiled in Usami (2012) and examines trends in real wage rates in rural areas in India over the last two decades. The data in this article are compiled from the Wage Rates in Rural India (WRRI) reported in the Indian Labour Journal, a monthly publication of the Labour Bureau, Government of India. The Labour Bureau provides WRRI data with a short time-lag, generally five months. The data for the agricultural year 2016–17 are now available, and allow us to study recent trends in agricultural and rural labour wage rates.
In order to check the reliability of WRRI data, we have obtained unit-level data that are collected for the WRRI by the Field Operations Division of the National Sample Survey Organisation (NSSO) from a fixed set of sample villages along with rural retail price data in Schedule No. 3.01(R). These unit-level data allow us to scrutinise and check the reliability of WRRI data.
Lastly, the article provides estimates of State-wise growth in wage rates for selected occupations and examines trends in female-male disparity with respect to agricultural wage rates.
Reliability and Problems of Data on Wage Rates in Rural India
To check the reliability of the WRRI data reported in the Indian Labour Journal, we cross-checked the reported series with unit-level data that are collected for WRRI by the Field Operations Division of the National Sample Survey Organisation (NSSO). The NSSO provides village-level data that cover the period between 2001 and 2011, excluding 2007 to 2008. Though the data are available for a relatively short period, they allow us to examine the reliability of WRRI data and to analyse regional variations at the sub-State level. To examine the reliability of WRRI data, we calculated State-wise averages for month, year, and major occupations from the unit-level data of NSSO and compared these with reported WRRI data. Our assumption is that the reported wage rates are correct if both calculated averages and reported wage rates are identical. The calculated averages, in most cases, however, were not identical with the reported wage data. A State-wise examination showed that a substantial number of identical cases occurred in Gujarat, Haryana, Manipur, Meghalaya, and Tripura. In other States, such as Andhra Pradesh, Kerala, Madhya Pradesh, Odisha, Uttar Pradesh, and West Bengal, however, there were no identical cases at all. This can be attributed to the fact that data are thoroughly scrutinised by the Labour Bureau, and discrepancies, if any, are referred to the NSSO for clarification and adjusted accordingly. It is not possible for a data user to ascertain every adjustment done by the Labour Bureau, other than cases of abnormal entry error. We checked the abnormal entry errors, such as errors in digits (Rs 800 instead of Rs 80), or an entry in the women’s column of figures that should have been in the men’s column, and found that these abnormal entry errors were corrected by the Labour Bureau’s adjustment. From this observation, we conclude that WRRI data are dependable.
A major problem in using WRRI data is the change in the classification of occupations that occurred in November 2013. Until October 2013, wage data were collected for 11 agricultural and seven non-agricultural occupations, as shown in Table 1. However, following the recommendations of the Working Group under the Chairmanship of T. S. Papola, wage data for 25 occupations, including 12 agricultural and 13 non-agricultural occupations, have been collected since November 2013. This re-classification of occupations was in order to capture changes in the occupational structure of the rural labour market.
Table 1 Revision in classification of occupations for Wage Rates in Rural India (WRRI), old and new series
| Old series (until October 2013) | New series (November 2013 onwards) |
| Agricultural Occupations | |
| Ploughing | Ploughing/tilling workers |
| Sowing | Sowing (including planting/transplanting/weeding) workers |
| Weeding | |
| Transplanting | |
| Harvesting | Harvesting/threshing/winnowing workers |
| Winnowing | |
| Threshing | |
| Picking | Picking workers (including tea, cotton, tobacco, and other commercial crops) |
| Herdsman | Animal husbandry workers (including poultry workers, dairy workers, and herdsmen) |
| Well-digging | |
| Cane-crushing | |
| Horticulture workers (including nursery growers) | |
| Fisherman-inland | |
| Fisherman-coastal/deep-sea | |
| Loggers and wood cutters | |
| Packaging labourers, agriculture | |
| General agricultural labourers (including watering/irrigation workers, etc.) | |
| Plant protection workers (applying pesticides, treating seeds, etc.) | |
| Non-agricultural occupations | |
| Carpenter | Carpenter |
| Blacksmith | Blacksmith |
| Mason | Mason |
| Tractor driver | LMV and tractor drivers |
| Sweeper | Sweeping/cleaning workers |
| Cobbler | |
| Weavers | |
| Beedi-makers | |
| Bamboo and cane-basket weavers | |
| Handicraft workers | |
| Plumbers | |
| Electricians | |
| Construction workers (for roads, dams, industrial and project construction work, and well diggers) | |
| Unskilled labourers | Non-agricultural labourers (including porters and loaders) |
Source: Indian Labour Journal, Labour Bureau.
The old series covered 11 agricultural operations (column 1), whereas in the new series (column 2) some occupations were merged, some were discarded, and seven new occupations were introduced. The three agricultural occupations that have been merged are ploughing and tilling, sowing (or planting) with transplanting and weeding, and harvesting with winnowing and threshing. In addition, six new agricultural occupations have been added to the list. These are: 1) horticulture workers (including nursery growers), 2) fisherman-inland, 3) fisherman-coastal/deep-sea, loggers and wood cutters, 4) packing labour (agriculture), 5) general agriculture (including watering/irrigation, etc.), and 6) plant protection workers (applying pesticides, treating seeds, etc.).
For non-agricultural occupations, the NSSO collected data on wage rates for seven non-agricultural occupations till October 2013. From November 2013, these were re-classified into 13 non-agricultural occupations. The new series has the following additional non-agricultural occupations: weavers, beedi makers, bamboo/cane basket weavers, handicraft workers, plumbers, electricians, construction workers (for roads, dams, industrial and project construction work, and well diggers), and non-agricultural labourers (including porters and loaders).
We attempted to create a long time-series covering the last two decades, but as a result of re-classification of occupations it was not possible to link the old series (up to October 2013) and the new series (November 2013 onwards). This is particularly difficult in cases where three different occupations are clubbed together. For example, it is well known that the wage rate for weeding is lower than the wage rate for sowing or transplanting, as is winnowing compared with harvesting or threshing. We decided to take a simple average of three occupations of the old series, for example sowing, transplanting, and weeding (hereafter STW) and link this with the new category that includes sowing (and also includes planting/transplanting and weeding). Similarly, we have taken a simple average of harvesting, threshing, and winnowing (hereafter HTW), and linked this with harvesting/winnowing/threshing workers in the new series. We expect the Labour Bureau to soon provide the linking factor.
Another serious problem that emerges from linking the old and the new series is the sharp increase in wage rates that occurred after November 2013, after the new series was released. Up to October 2013, the year-on-year percentage increase in wage rates showed a gradual decline, with a fairly consistent pattern in levels and monthly fluctuation across all occupations. Figure 1 shows the year-on-year change in wage rates over the previous year for major occupations at the all-India level. These figures clearly show the jump in the year following November 2013. A sudden increase took place in November 2013 and the level continued for one year. The increase can be seen across all occupations, not only STW or HTW, but also ploughing and non-agricultural occupations. This suggests that the increase is not caused by the reclassification of occupations alone. At the State level, the increase is significant in November or December 2013 for many States. Unfortunately, it is not possible for us to identify a reason for the increase in 2013. There could have been a change in sample villages or a change in data sources. The average growth rate for the recent period would be pulled up on account of this sharp increase in November 2013.
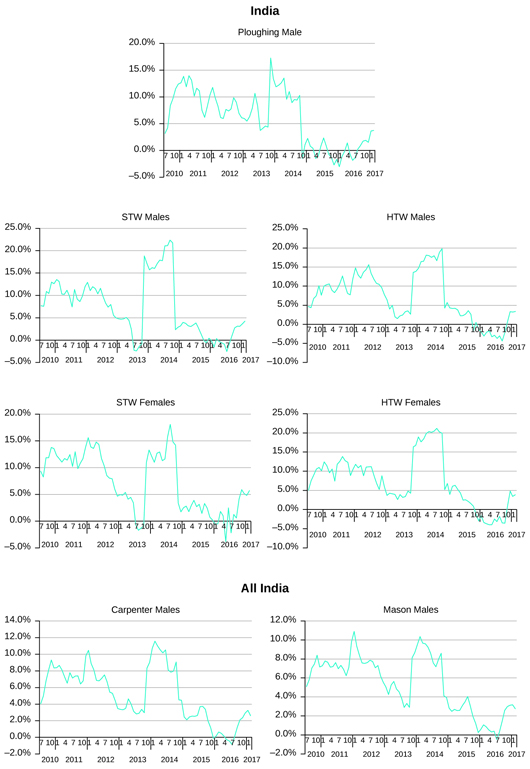
Figure 1 Year-on-year growth in wage rates, by occupation (sex), all-India, 2010–17 in per cent
Source: Computed from Wage Rates in Rural India, various issues.
Levels and Growth of Real Wages for Agricultural and Rural Labourers
We now examine trends in wage rates using the old series for seven occupations (field operations), that is, ploughing (male), sowing (male and female), weeding (male and female), transplanting (male and female), harvesting (male and female), threshing (male and female), and winnowing (male and female). From the new series, we chose ploughing (male), sowing (including planting/transplanting/weeding), and harvesting/threshing/winnowing (HTW). For non-agricultural occupations, we examined data on masons (male), carpenters (male), blacksmiths (male), and unskilled labourers/non-agricultural labourer (male and female). To arrive at the real wage rates for each State, annual averages of nominal wages were first computed for the agricultural year (July to June). The nominal wage rates were then deflated by the consumer price index for agricultural labourers (CPI-AL) and by the consumer price index for rural labourers (CPI-RL), for agricultural and rural labourers, respectively. Though the base year of both consumer price indices was 1986–87, the wage rates in this article are expressed at 2009–10 prices for the sake of convenience.
Figures 2 and 3 show the real agricultural and rural labour wage rates at the all-India level over the last 18 years, from 1998–99 to 2016–17. This period can be further divided into three sub-periods; 1998–99 to 2006–7, 2006–7 to 2014–15, and 2014–15 to 2016–17. In the sub-period between 1998–99 and 2006–7, the trend in wage rates for major agricultural and rural occupations remained stagnant or declined at the all-India level. Real wage rates in this period ranged between Rs 112 and Rs 119 for ploughing, between Rs 94 to Rs 98 for sowing/transplanting/weeding (STW), and between Rs 90 to Rs 96 for harvesting/threshing/winnowing (HTW). The wage rates for skilled workers such as carpenters ranged from Rs 167 to Rs 175 and from Rs 177 to Rs 189 for masons, while the wage rate of unskilled labour was between Rs 91 and Rs 93. Thus, in spite of the high growth of the Indian economy in this period, agricultural and rural wage labourers were unable to enjoy the benefits of macroeconomic prosperity. This was partly due to multiple years of drought that led to a decline in agricultural production and partly due to very low agricultural prices in real terms, in particular relatively low Minimum Support Prices.
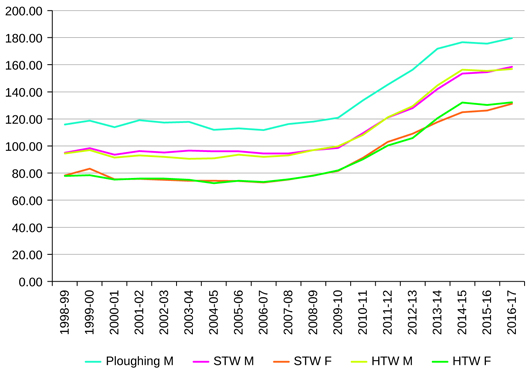
Figure 2 Real wage rates for various agricultural occupations, 1998–99 to 2016–17 in Rupees
Source: Computed from Wage Rates in Rural India, various issues.
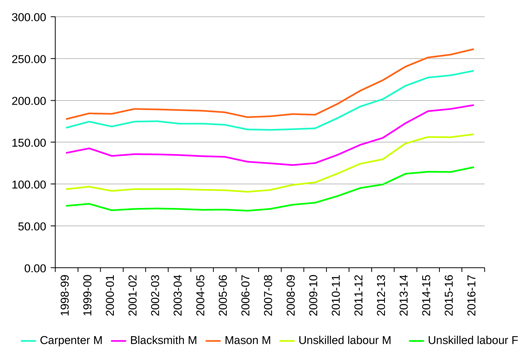
Figure 3 Real wage rates for various non-agricultural occupations, 1998–99 to 2016–17 in Rupees
Source: Computed from Wage Rates in Rural India, various issues.
However, from 2007–8, real wage rates began to rise sharply and this trend continued till 2014–15. The real wage rate for ploughing rose from Rs 116.1 in 2007–8 to Rs 176.6 in 2014–15. Wage rates for males for STW rose from Rs 94.5 to Rs 153.4, and from Rs 93.1 to Rs 156.3 for HTW in the same period. Similarly, non-agricultural wage rates for males rose substantially in the same period: from Rs 164.8 to 227.4 for carpenters, from Rs 181 to Rs 251.3 for masons, and from Rs 92.8 to Rs 157 for unskilled labourers.
It is noteworthy that wage rates for female occupations showed a similar pattern. Real wage rates for female occupations were stagnant till 2006–7. However, from 2007–8, there was a rapid growth in female wage rates. The female wage rate for sowing/transplanting/weeding, at the all-India level, rose from Rs 75.1 in 2007–8 to Rs 124.9 in 2014–15. Wage rates for female unskilled labour (non-agriculture) rose from Rs 70.3 to Rs 114.6 in the same period.
We now turn to regional variations in the trends of agricultural and rural labour wage rates. Tables 2, 3, and 4 depict the average growth rate of real wage rates by State and occupation for the first and second sub-periods. We highlight some of the features of the regional variation across States.
Table 2 Average annual rate of growth of wage rates for major occupations in rural India in per cent
| State | Ploughing (Male) | STW (Male) | STW (Female) | HTW (Male) | ||||
| 1998–99 to 2006–7 | 2006–7 to 2014–15 | 1998–99 to 2006–7 | 2006–7 to 2014–15 | 1998–99 to 2006–7 | 2006–7 to 2014–15 | 1998–99 to 2006–7 | 2006–7 to 2014–15 | |
| Growth rate | Growth rate | Growth rate | Growth rate | Growth rate | Growth rate | Growth rate | Growth rate | |
| Andhra Pradesh | 1.16∗ | 7.1∗∗ | 2.4∗∗∗ | 6.2∗∗∗ | 1.0∗ | 7.3∗∗∗ | 1.1 | 5.6∗∗∗ |
| Assam | −1∗∗ | 6.1∗∗∗ | 3.0∗∗∗ | 4.1∗∗∗ | −0.3 | 4.9∗∗∗ | 2.5∗∗∗ | 5.7∗∗∗ |
| Bihar | 3∗∗∗ | 8.2∗∗∗ | 1.6 | 10.0∗∗∗ | 1.8 | 9.4∗∗∗ | 3.1∗∗ | 9.1∗∗∗ |
| Gujarat | 2∗∗∗ | 2.7∗∗ | 0.7 | 4.0∗∗ | 0.5 | 4.9∗∗∗ | −0.5∗∗ | 4.0∗∗∗ |
| Haryana | 0.3 | 7.7∗∗∗ | 0.7 | 5.1∗∗∗ | 2.2∗∗ | 5.4∗∗∗ | 1.2∗ | 4.7∗∗∗ |
| Himachal Pradesh | 3.3∗∗∗ | 4.3∗∗∗ | 2.3∗∗ | 4.7∗∗∗ | 1.9∗∗ | 5.9∗∗∗ | ||
| Jammu and Kashmir | 1.3 | 6.2∗∗∗ | 3.7∗∗ | 6.8∗∗∗ | 3.2∗ | 7.4∗∗∗ | ||
| Karnataka | 1.3 | 9.2∗∗∗ | 4.1∗∗ | 7.4∗∗∗ | 0.2 | 7.3∗∗∗ | 0.7 | 8.0∗∗∗ |
| Kerala | 0.7 | 4.0∗∗∗ | 0.7 | 5.0∗∗∗ | 0.3 | 8.6∗∗∗ | 8.9∗∗∗ | |
| Madhya Pradesh | 0.1 | 6.7∗∗∗ | −0.5 | 7.7∗∗∗ | −1.4∗∗ | 9.1∗∗∗ | −0.6 | 8.9∗∗∗ |
| Maharashtra | 0.1 | 6.9∗∗∗ | −0.5 | 6.1∗∗∗ | −0.9 | 7.0∗∗∗ | 1.2 | 6.8∗∗∗ |
| Manipur | 2.2∗∗ | 6.0∗∗∗ | 1.3 | 9.2∗∗∗ | 1.5 | 9.3∗∗∗ | 0.1 | 10.7∗∗∗ |
| Meghalaya | 4.1∗∗∗ | 4.4∗∗ | 3.7∗∗∗ | 2.8 | 3.2∗∗ | 3.3∗ | 4.9∗∗∗ | 3.5∗ |
| Odisha | 3.2∗∗ | 7.5∗∗∗ | 3.3∗∗ | 6.4∗∗∗ | 2.9∗∗ | 7.8∗∗∗ | 2.5∗∗ | 8.8∗∗∗ |
| Punjab | 3.5∗∗ | 6.6∗∗∗ | 0.4 | 6.4∗∗∗ | 1.6∗ | 6.0∗∗∗ | ||
| Rajasthan | −1.3 | 4.6∗∗∗ | −2.1 | 6.9∗∗∗ | −2.8∗∗ | 6.6∗∗∗ | −4.3∗∗∗ | 8.5∗∗∗ |
| Tamil Nadu | −0.7 | 8.5∗∗∗ | 0.6 | 8.8∗∗∗ | −0.2 | 9.6∗∗∗ | −1 | 10.5∗∗∗ |
| Tripura | 6.2∗∗∗ | 2.7∗ | 6.0∗∗∗ | 2.6∗ | 6.2∗∗∗ | 2.7∗ | ||
| Uttar Pradesh | 0.3 | 6.3∗∗∗ | 0 | 6.9∗∗∗ | 0.4 | 6.9∗∗∗ | 0.1 | 7.4∗∗∗ |
| West Bengal | 3.3∗∗∗ | 4.9∗∗∗ | 2.6∗∗∗ | 5.8∗∗∗ | 2.7∗∗∗ | 6.8∗∗∗ | 3.2∗∗∗ | 6.4∗∗∗ |
| India | −0.6∗ | 6.4∗∗∗ | −0.1 | 6.5∗∗∗ | −1.1∗∗ | 7.6∗∗∗ | −0.40% | 7.3∗∗∗ |
Note: ∗, ∗∗, and ∗∗∗ stand for significance level at 10, 5, and 1 per cent respectively.
Source: Computed from Wage Rates in Rural India, various issues.
Table 3 Average annual rate of growth of wage rates for major occupations in rural India in per cent
| State | HTW (Female) | Mason (Male) | Blacksmith (Male) | |||
| 1998–99 to 2006–7 | 2006–7 to 2014–15 | 1998–99 to 2006–7 | 2006–7 to 2014–15 | 1998–99 to 2006–7 | 2006–7 to 2014–15 | |
| Growth rate | Growth rate | Growth rate | Growth rate | Growth rate | Growth rate | |
| Andhra Pradesh | −0.2 | 5.4∗∗∗ | 1.2∗ | 4.5∗∗∗ | 0.8 | 5∗∗∗ |
| Assam | 0.6 | 5.1∗∗∗ | 3.6∗∗∗ | 2.5∗ | 4.2∗∗∗ | 7∗∗∗ |
| Bihar | 3.8∗∗ | 8.9∗∗∗ | 3∗∗ | 6∗∗∗ | 2.58∗ | 6.4∗∗∗ |
| Gujarat | −0.1 | 4.3∗∗∗ | −0.8 | 3∗ | −2.4 | 2 |
| Haryana | 1.9∗∗ | 4.9∗∗∗ | 0.5 | 1 | −2.4∗∗ | 1.7 |
| Himachal Pradesh | 0.2∗∗ | 3∗∗∗ | 1.9∗∗ | 1.3∗∗ | ||
| Jammu and Kashmir | −0.08 | 4∗∗∗ | 0.57 | 9 | ||
| Karnataka | 0.4 | 6.1∗∗∗ | 2∗ | 2.5∗∗ | 0.78 | 4∗∗∗ |
| Kerala | 1.6∗∗ | 7.8∗∗∗ | 1.3∗∗∗ | 6.4∗∗∗ | 2.1∗∗∗ | 4.7∗∗∗ |
| Madhya Pradesh | −1.5∗∗ | 10.0∗∗∗ | −0.23 | 1.7 | 0.2 | 2.6∗∗ |
| Maharashtra | −0.4 | 8.1∗∗∗ | 1.9∗ | 3.8∗∗∗ | 0.8 | 4.4∗∗∗ |
| Manipur | 1 | 10.4∗∗∗ | 1.3∗ | 8.4∗∗∗ | 3.5∗∗∗ | 8∗∗∗ |
| Meghalaya | 2.1∗ | 2.9∗∗∗ | 1.5 | 2.3∗∗ | 2.4∗∗ | 4∗∗∗ |
| Odisha | 1.2 | 10.3∗∗∗ | 3∗ | 4∗∗∗ | 1.2 | 1 |
| Punjab | −1.3∗ | 3.7∗∗∗ | −0.9∗∗ | 1 | ||
| Rajasthan | −4.8∗∗ | 8.1∗∗∗ | −1.5 | 5∗∗∗ | −2.2 | 7∗∗∗ |
| Tamil Nadu | 0.3 | 9.8∗∗∗ | 2∗ | 8∗∗∗ | 0.82 | 8∗∗∗ |
| Tripura | 5∗∗∗ | 3 | 9.5∗∗∗ | 2 | ||
| Uttar Pradesh | −0.1 | 7.0∗∗∗ | 0.68 | 6∗∗∗ | 2∗ | 4∗∗∗ |
| West Bengal | 3.2∗∗∗ | 6.7∗∗∗ | 2.3∗∗ | 4∗∗ | −1 | 5∗∗ |
| India | −0.8∗∗∗ | 7.9∗∗∗ | 0.15 | 4.2∗∗∗ | −0.9∗∗ | 4.6∗∗∗ |
Note: ∗, ∗∗, and ∗∗∗ stand for significance level at 10, 5, and 1 per cent respectively.
Source: Computed from Wage Rates in Rural India, various issues.
Table 4 Average annual rate of growth of wage rates for major occupations in rural India in per cent
| State | Carpenter (Male) | Unskilled (Male) | Unskilled (Female) | |||
| 1998–99 to 2006–7 | 2006–7 to 2014–15 | 1998–99 to 2006–7 | 2006–7 to 2014–15 | 1998–99 to 2006–7 | 2006–7 to 2014–15 | |
| Growth rate | Growth rate | Growth rate | Growth rate | Growth rate | Growth rate | |
| Andhra Pradesh | 0.3 | 6∗∗∗ | 0.2 | 7.8∗∗∗ | 0.3 | 7.9∗∗∗ |
| Assam | 3∗∗∗ | 2.2 | 3.6∗∗∗ | 4.7∗∗∗ | −0.13 | 7.4∗∗∗ |
| Bihar | 3.2∗∗ | 5.8∗∗∗ | 3∗∗ | 8.7∗∗∗ | 3.3∗∗ | 8.65∗∗∗ |
| Gujarat | −0.23 | 1.3 | −0.72 | 4∗∗ | −0.12 | 4.3∗∗ |
| Haryana | −1.4∗ | 3.5∗∗∗ | 0.43 | 5.25∗∗∗ | 1.5 | 4.9∗∗∗ |
| Himachal Pradesh | 1.7∗∗ | 2.4∗∗ | 2∗∗ | 3.6∗∗∗ | 4.9∗∗ | |
| Jammu and Kashmir | 0.08 | 3.8 | 1.1 | 8∗∗∗ | ||
| Karnataka | 1.6 | 3.1∗∗∗ | 1.4∗∗ | 6.6∗∗∗ | 0.93 | 6.6∗∗∗ |
| Kerala | 1.2∗∗∗ | 6∗∗∗ | 1.2∗∗∗ | 7.65∗∗∗ | 3.2∗∗∗ | 4.5∗∗∗ |
| Madhya Pradesh | 0.2 | 1.3 | −0.8∗∗ | 7∗∗∗ | −1.5∗∗∗ | 7.1∗∗∗ |
| Maharashtra | 0.8 | 3.2 | −0.2 | 6.5∗∗ | −1.3∗∗∗ | 6.4∗∗∗ |
| Manipur | 1.6∗∗ | 6.7∗∗∗ | 1.27∗∗ | 6.2∗∗∗ | 1.4∗ | 7.2∗∗∗ |
| Meghalaya | 3∗∗∗ | −1.4∗ | 4.7∗∗∗ | 2.3 | −0.19 | 2.2∗∗ |
| Odisha | 3.7∗∗∗ | 3.3∗∗ | 3∗∗∗ | 7.8∗∗∗ | 2∗∗ | 9.6∗∗∗ |
| Punjab | −1.3∗∗∗ | 3.5∗∗∗ | −0.7∗ | 6∗∗∗ | 2.1 | 2.35 |
| Rajasthan | 3.7∗∗∗ | −1.1 | 7.4∗∗∗ | −0.3 | 7.8∗∗∗ | |
| Tamil Nadu | 1.3 | 8.8∗∗∗ | 1.7∗∗ | 8.7∗∗∗ | 2.5∗∗ | 8.5∗∗∗ |
| Tripura | 4.3∗∗∗ | 2 | 5.9∗∗∗ | 1.7∗∗∗ | – | – |
| Uttar Pradesh | 0.8 | 5.1∗∗∗ | 0.1 | 7.6∗∗∗ | 0.6 | 8.1∗∗∗ |
| West Bengal | 1.7∗∗ | 2.8∗ | 2∗ | 6.85∗∗∗ | 2.4∗∗ | 6.74∗∗∗ |
| India | −0.1 | 4.1∗∗∗ | −0.4∗∗ | 7∗∗∗ | −0.1∗ | 7.2∗∗∗ |
Note: ∗, ∗∗, and ∗∗∗ stand for significance level at 10, 5, and 1 per cent respectively.
Source: Computed from Wage Rates in Rural India, various issues.
Six eastern and north-eastern States, namely, Bihar, Manipur, Meghalaya, Odisha, Tripura, and West Bengal, as well as Himachal Pradesh, witnessed a stable rising trend of agricultural wage rates in the first sub-period. It is noteworthy that non-agricultural wage rates also showed a stable growth in these States. These relatively low-wage regions, with the exception of Himachal Pradesh, thus caught up with the high-wage regions in this sub-period.
Secondly, Madhya Pradesh and Rajasthan recorded a negative growth rate in agricultural wage rates. The wage rates for both male and female unskilled workers declined in Madhya Pradesh. Wage rates for agricultural and rural labour in Uttar Pradesh were stagnant and did not show any clear time trend.
In Assam, agricultural and non-agricultural wage rates for male labourers recorded stable growth but female wage rates remained stagnant. Gujarat presented a mixed picture: while wage rates for ploughing grew, wage rates for the remaining occupations, in particular non-agricultural tasks, declined.
Non-agricultural wage rates in Punjab, for skilled and unskilled labour, showed negative growth in this sub-period. Wage rates of non-agricultural occupations recorded positive growth in Kerala and Tamil Nadu, while agricultural wage rates in these States did not show a clear-cut time trend.
These observations indicate that while agricultural and rural labour wage rates at the all-India level remained stagnant or declined slightly, a number of States in the eastern region recorded a rising trend and as a result regional disparity in wage rates could have been reduced in the first sub-period.
Turning to the second sub-period, the growth of agricultural and rural labour wage rates in real terms after 2007–8 is remarkable. In this period, the growth rate for wage rates of all major agricultural occupations increased by more than 6 per cent per annum at the all-India level. In short, the trend of rising agricultural wage rates was an all-India phenomenon. All States recorded a positive growth rate, though the average growth rate varied across States. It is striking that Bihar and Tamil Nadu recorded the fastest growth in both agricultural and non-agricultural wage rates. At the beginning of this century, Bihar had the lowest agricultural wage rates, but at the time of writing this article, the wage rate in Bihar was higher than that in Gujarat, Karnataka, Madhya Pradesh, and Maharashtra. The north-eastern States of Meghalaya and Tripura registered a comparatively slower growth in the second sub-period.
Berg et al. (2012), Gulati, Jain, and Satija (2013), and Himanshu and Kundu (2016) have written about the rise in real wage rates and reasons for the same. We do not dwell on these factors in this article.
There is one feature of this period that needs to be noted separately, namely the jump in wage rates in November 2013. An important question that arises is whether the growth rate would have declined if there was no jump in wage rates after November 2013. The growth rates for the period 2006–7 to 2012–13, excluding the last two years, show that the growth rates at the all-India level declined by 0.3 percentage points for STW female (7.6 per cent to 7.3 per cent), and by 1.2 percentage points for HTW male (7.3 per cent to 6.1 per cent). Nevertheless, this does not negate the stable growth of more than 5.5 per cent per year during the second sub-period.
The growth in real wage rates of about 6 per cent per annum for a period of seven to eight years seems to have ended in 2015–16. However, a marginal revival of real wage rates was observed in 2016–17. In 2015–16, real wage rates for major agricultural operations declined in States such as Tamil Nadu, Rajasthan, and Maharashtra. On the other hand, real wage rates for agricultural occupations rose in Meghalaya, Andhra Pradesh, Assam, Bihar, Karnataka, and Odisha.
Non-agricultural occupations also registered a similar trend. Wage rates in non-agricultural occupations rose in Odisha, Madhya Pradesh, Bihar, Uttar Pradesh, and West Bengal. Between 2015–16 and 2016–17, the nominal wage rates for major rural occupations were comparatively stable. The fluctuation of real wage rates in this period was mainly due to movements of prices.
State-wise trends in real wage rates by occupation and gender, as calculated by us, are reported in Appendix Tables 1-10.
Male and Female Wage Differentials
Tables 5, 6, and 7 show the ratio of female to male wage rates for sowing/transplanting/weeding (STW), harvesting/threshing/winnowing (HTW), and unskilled labour for three time periods: 1998–99 to 2000–1, 2006–7 to 2008–9, and 2013–14 to 2016–2017, at real prices. We use a three-year average to compare the beginning and end of the sub-periods under study.
Table 5 Changes in female-male ratio of wage rates for sowing/transplanting/weeding (STW)
| State | Female/male ratio (STW) | ||
| 1998–99 to 2000–1 | 2006–7 to 2008–9 | 2014–15 to 2016–17 | |
| Andhra Pradesh | 0.76 | 0.74 | 0.75 |
| Assam | 1.06 | 0.87 | 0.87 |
| Bihar | 0.9 | 0.91 | 0.85 |
| Gujarat | 0.91 | 0.89 | 0.95 |
| Haryana | 0.86 | 0.95 | 0.96 |
| Himachal Pradesh | |||
| Jammu and Kashmir | |||
| Karnataka | 0.73 | 0.72 | 0.71 |
| Kerala | 0.68 | 0.55 | 0.73 |
| Madhya Pradesh | 0.87 | 0.85 | 0.94 |
| Maharashtra | 0.7 | 0.65 | 0.67 |
| Manipur | 0.95 | 0.9 | 0.86 |
| Meghalaya | 0.73 | 0.71 | 0.73 |
| Odisha | 0.86 | 0.78 | 0.82 |
| Punjab | |||
| Rajasthan | 0.79 | 0.8 | 0.81 |
| Tamil Nadu | 0.64 | 0.63 | 0.63 |
| Tripura | |||
| Uttar Pradesh | 0.84 | 0.86 | 0.88 |
| West Bengal | 0.91 | 0.89 | 0.91 |
| India | 0.83 | 0.79 | 0.82 |
Note: The gaps represent years for which female wage rates are not reported.
Source: Computed from Wage Rates in Rural India, various issues.
Table 6 Changes in female-male ratio of wage rates for harvesting/threshing/winnowing (HTW)
| State | Female/male ratio (HTW) | ||
| 1998–99 to 2000–1 | 2006–7 to 2008–9 | 2014–15 to 2016–17 | |
| Andhra Pradesh | 0.80 | 0.75 | 0.77 |
| Assam | 1.03 | 0.90 | 0.85 |
| Bihar | 0.85 | 0.92 | 0.91 |
| Gujarat | 0.93 | 0.97 | 0.98 |
| Haryana | 0.96 | 0.98 | 0.99 |
| Himachal Pradesh | 0.90 | 1.00 | 0.50 |
| Jammu and Kashmir | 1.49 | 0.59 | |
| Karnataka | 0.76 | 0.76 | 0.69 |
| Kerala | 0.74 | 0.86 | 0.77 |
| Madhya Pradesh | 0.88 | 0.85 | 0.92 |
| Maharashtra | 0.71 | 0.64 | 0.69 |
| Manipur | 0.87 | 0.90 | 0.90 |
| Meghalaya | 0.81 | 0.69 | 0.62 |
| Odisha | 0.85 | 0.76 | 0.84 |
| Punjab | 0.81 | 0.82 | |
| Rajasthan | 0.90 | 0.90 | 0.83 |
| Tamil Nadu | 0.66 | 0.70 | 0.61 |
| Tripura | 0.79 | ||
| Uttar Pradesh | 0.86 | 0.89 | 0.85 |
| West Bengal | 0.91 | 0.90 | 0.90 |
| India | 0.82 | 0.80 | 0.84 |
Note: The gaps represent years for which female wage rates are not reported.
Source: Computed from Wage Rates in Rural India, various issues.
Table 7 Changes in female-male ratio of wage rates for unskilled labourers
| State | Female/male ratio (Unskilled labourer) | ||
| 1998–99 to 2000–1 | 2006–7 to 2008–9 | 2014–15 to 2016–17 | |
| Andhra Pradesh | 0.71 | 0.72 | 0.67 |
| Assam | 0.88 | 0.73 | 0.98 |
| Bihar | 0.87 | 0.89 | 0.85 |
| Gujarat | 0.93 | 0.97 | 1.02 |
| Haryana | |||
| Himachal Pradesh | |||
| Jammu and Kashmir | |||
| Karnataka | 0.75 | 0.74 | 0.75 |
| Kerala | |||
| Madhya Pradesh | 0.88 | 0.86 | 0.81 |
| Maharashtra | 0.68 | 0.64 | 0.63 |
| Manipur | |||
| Meghalaya | |||
| Odisha | 0.89 | 0.83 | 0.92 |
| Punjab | |||
| Rajasthan | |||
| Tamil Nadu | 0.67 | 0.73 | 0.69 |
| Tripura | |||
| Uttar Pradesh | 0.81 | 0.83 | 0.86 |
| West Bengal | 0.88 | 0.89 | 0.85 |
| India | 0.78 | 0.76 | 0.74 |
Note: The gaps represent years for which female wage rates are not reported.
Source: Computed from Wage Rates in Rural India, various issues.
For major agricultural operations such as STW and HTW, the male-female wage rate disparity at the all-India level is not very large (above 0.8). However, there is substantial variation in the male-female wage gap across States. The disparity in wage rates has either been stagnant or declined at the all-India level as well as at the State level over time, with a few exceptions. The ratios indicate that the male-female wage disparity is relatively large in Andhra Pradesh, Karnataka, Kerala, Maharashtra, Meghalaya, and Tamil Nadu, while it is rather small in Bihar, Gujarat, Haryana, Manipur, and West Bengal.
The gap in wage rates for male and female unskilled labour was relatively higher at the all-India level as compared to the wage gap for field operations (STW and HTW). The gap in wage rates is relatively low for Assam, Gujarat, Odisha, Uttar Pradesh, and West Bengal; whereas the disparity is high in Andhra Pradesh, Karnataka, Maharashtra, and Tamil Nadu.
Conclusions
This article examined the levels and trends of real wages rates in rural India using the Labour Bureau’s WRRI data, revised and updated by the authors. We checked the reliability of the data using unit-level data provided by the NSSO and concluded that WRRI data are likely to be reliable. Nevertheless, there are several problems in using WRRI data, one of which is the change in definition of occupations in November 2013, and the absence of a linking factor that makes linking the old and new series a complex task. Another problem is the unexplained sudden increase in wage rates in November 2013.
After a period of stagnation and decline, agricultural wages registered substantial growth from 2007–8 onwards. It is noteworthy that this growth was above 5.5 per cent per annum for most large States, and across all occupations, agricultural and non-agricultural, and for males and females. The steady growth of agricultural and rural labour wages ended in 2014–15. Wages started declining in 2015–16, but started growing in the latter half of 2016–17. Agricultural and rural labour wages were stable in nominal terms over these two years and the fluctuation in real terms was largely because of the movement of price indices. The reasons for this pattern of growth are likely to be complex and need further study.
Lastly, in spite of a period of high growth in agricultural and non-agricultural wage rates, the female-male disparity has not shown a tendency to fall, and this is another area for further study.
Acknowledgements: The authors are grateful to the editorial team of the journal for their suggestions and to Rakesh K. Mahato for assistance with data processing.
References
| Berg, Erlend, Bhattacharyya, Sambit, Durgam, Rajasekhar, and Ramachandra, Manjula (2012), “Can Rural Public Works Affect Agricultural Wages? Evidence from India,” CSAE Working Paper WPS/2012–05, Centre for the Study of African Economies, Department of Economics, University of Oxford.
| |
| Gulati, Ashok, Jain, Surbhi, and Satija, Nidhi (2013), “Rising Farm Wages in India: The ‘Pull’ and ‘Push’ Factors,” Discussion Paper No. 5, Commission for Agricultural Costs and Prices, Department of Agriculture and Cooperation, Ministry of Agriculture, Government of India, New Delhi.
| |
| Himanshu, and Kundu, Sujata (2016), “Rural Wages in India: Recent Trends and Determinants,” Indian Journal of Labour Economics, vol. 59,
| |
| Usami, Yoshifumi (2012), “Recent Trends in Wage Rates in Rural India: An Update,” Review of Agrarian Studies, vol. 2, no. 1, available at http://ras.org.in/recent_trends_in_wage_rates_in_rural_india, viewed on December 9, 2017.
|

Appendix
Appendix Table 1 State–wise real wage rates for ploughing occupations in rural India, 1998–2017 in Rupees
| Ploughing (Male) | 1998–99 | 1999–2000 | 2000–1 | 2001–2 | 2002–3 | 2003–4 | 2004–5 | 2005–6 | 2006–7 | 2007–8 |
| Andhra Pradesh | 94.50 | 89.81 | 97.26 | 97.47 | 100.26 | 95.35 | 93.02 | 100.90 | 105.96 | 114.89 |
| Assam | 104.46 | 104.21 | 106.86 | 108.57 | 101.24 | 105.62 | 100.72 | 97.39 | 98.62 | 100.95 |
| Bihar | 71.56 | 75.73 | 85.18 | 91.14 | 92.40 | 93.67 | 92.41 | 91.56 | 91.69 | 93.34 |
| Gujarat | 95.15 | 94.93 | 101.83 | 109.42 | 107.58 | 109.80 | 112.77 | 112.44 | 106.53 | 111.28 |
| Haryana | 135.04 | 145.09 | 155.29 | 144.75 | 149.00 | 145.39 | 147.35 | 145.29 | 145.26 | 150.26 |
| Himachal Pradesh | 143.07 | 139.54 | 153.75 | 156.90 | 151.81 | 172.07 | 178.71 | 168.82 | 182.26 | 206.74 |
| Jammu and Kashmir | 154.62 | 151.19 | 180.66 | 188.29 | 184.25 | 183.33 | 184.24 | 182.92 | 162.75 | 164.42 |
| Karnataka | 80.12 | 83.38 | 98.02 | 99.05 | 95.80 | 92.98 | 90.35 | 95.81 | 92.96 | 96.56 |
| Kerala | 292.89 | 281.79 | 294.42 | 368.20 | 365.16 | 347.99 | 300.80 | 293.53 | 314.80 | 337.30 |
| Madhya Pradesh | 76.98 | 76.37 | 75.93 | 82.29 | 81.00 | 84.13 | 81.36 | 77.06 | 74.76 | 78.17 |
| Maharashtra | 94.38 | 100.05 | 111.21 | 107.51 | 109.71 | 105.64 | 99.64 | 99.19 | 102.91 | 107.58 |
| Manipur | 82.46 | 85.82 | 95.08 | 92.61 | 91.85 | 103.21 | 104.30 | 98.71 | 95.01 | 117.46 |
| Meghalaya | 93.45 | 91.20 | 90.33 | 91.48 | 107.14 | 124.97 | 121.68 | 117.63 | 112.33 | 107.56 |
| Odisha | 67.78 | 63.18 | 78.88 | 88.38 | 91.24 | 84.84 | 88.64 | 87.35 | 81.08 | 78.08 |
| Punjab | 124.35 | 125.85 | 113.73 | 138.47 | 145.39 | 134.17 | 141.48 | 173.97 | 126.18 | |
| Rajasthan | 145.47 | 136.00 | 156.54 | 167.95 | 153.71 | 148.09 | 148.12 | 135.26 | 127.06 | 153.49 |
| Tamil Nadu | 156.24 | 181.71 | 192.83 | 190.87 | 176.82 | 172.52 | 165.71 | 163.65 | 168.91 | 176.71 |
| Tripura | 69.45 | 74.87 | 78.05 | 86.27 | 88.12 | 105.24 | 97.95 | 108.62 | 109.50 | 103.05 |
| Uttar Pradesh | 84.09 | 91.58 | 98.40 | 97.47 | 95.91 | 97.88 | 95.98 | 92.00 | 88.40 | 92.47 |
| West Bengal | 101.23 | 117.74 | 120.19 | 120.58 | 129.76 | 132.52 | 124.50 | 138.94 | 140.15 | 136.78 |
| India | 115.79 | 118.66 | 113.96 | 119.04 | 117.37 | 117.84 | 112.01 | 112.98 | 111.72 | 116.14 |
| Ploughing (Male) | 2008–9 | 2009–10 | 2010–11 | 2011–12 | 2012–13 | 2013–14 | 2014–15 | 2015–16 | 2016–17 | |
| Andhra Pradesh | 129.25 | 140.01 | 166.42 | 171.85 | 184.80 | 172.74 | 173.02 | 178.34 | 178.28 | |
| Assam | 98.60 | 97.48 | 108.43 | 115.22 | 120.98 | 141.11 | 162.51 | 164.68 | 170.73 | |
| Bihar | 96.17 | 107.09 | 114.40 | 126.44 | 144.85 | 151.88 | 162.79 | 178.00 | 181.24 | |
| Gujarat | 114.47 | 102.18 | 100.79 | 119.17 | 121.57 | 121.76 | 138.39 | 140.02 | 151.01 | |
| Haryana | 155.75 | 163.62 | 180.43 | 188.94 | 220.34 | 251.84 | 242.13 | 252.00 | 228.44 | |
| Himachal Pradesh | 219.95 | 202.40 | 205.40 | 224.04 | 233.39 | 263.25 | 269.89 | 284.11 | 291.75 | |
| Jammu and Kashmir | 162.26 | 173.15 | 193.32 | 197.45 | 215.05 | 239.72 | 255.02 | 260.33 | 263.68 | |
| Karnataka | 101.14 | 98.22 | 113.41 | 126.62 | 149.87 | 171.68 | 174.35 | 171.95 | 168.20 | |
| Kerala | 320.08 | 321.12 | 350.73 | 393.94 | 418.39 | 415.77 | 405.48 | 412.81 | 389.47 | |
| Madhya Pradesh | 82.03 | 77.58 | 82.98 | 91.76 | 98.80 | 116.02 | 127.73 | 130.66 | 138.10 | |
| Maharashtra | 108.92 | 108.57 | 120.74 | 138.64 | 152.37 | 168.22 | 158.29 | 154.60 | 161.19 | |
| Manipur | 121.83 | 114.63 | 118.39 | 126.26 | 145.96 | 156.08 | 164.84 | 173.40 | 170.49 | |
| Meghalaya | 98.11 | 99.25 | 103.76 | 101.70 | 113.73 | 140.96 | 162.13 | 160.19 | 173.23 | |
| Odisha | 85.12 | 98.38 | 120.75 | 131.58 | 116.92 | 120.40 | 137.81 | 143.30 | 155.97 | |
| Punjab | 163.52 | 141.53 | 179.80 | 187.51 | 196.86 | 246.77 | 232.71 | 214.89 | 215.65 | |
| Rajasthan | 149.18 | 138.77 | 131.75 | 168.72 | 177.49 | 190.55 | 186.15 | 170.28 | 161.71 | |
| Tamil Nadu | 169.77 | 194.85 | 217.08 | 236.26 | 253.24 | 272.29 | 323.70 | 266.74 | 259.27 | |
| Tripura | 112.50 | 109.82 | 99.39 | 97.63 | 116.21 | 135.77 | 134.05 | 101.51 | 145.63 | |
| Uttar Pradesh | 98.54 | 100.17 | 110.88 | 116.43 | 128.81 | 136.85 | 139.20 | 144.35 | 155.53 | |
| West Bengal | 134.98 | 133.17 | 140.33 | 161.84 | 166.25 | 189.59 | 192.73 | 207.79 | 206.51 | |
| India | 118.05 | 120.85 | 133.66 | 145.25 | 156.33 | 171.83 | 176.61 | 175.56 | 179.68 |
Note: CPI-AL (2009–10=100) is used as a deflator.
Appendix Table 2 State–wise real wage rates for sowing/transplanting/weeding (male) occupations in rural India, 1998–2017 in Rupees
| Sowing/Transplanting /Weeding (Male) | 1998–99 | 1999–2000 | 2000–1 | 2001–2 | 2002–3 | 2003–4 | 2004–5 | 2005–6 | 2006–7 | 2007–8 |
| Andhra Pradesh | 71.6 | 69.15 | 77.20 | 78.34 | 80.77 | 79.91 | 79.37 | 80.86 | 88.91 | 91.84 |
| Assam | 75.5 | 82.51 | 87.51 | 88.78 | 89.47 | 96.42 | 95.49 | 95.99 | 98.07 | 98.48 |
| Bihar | 67.1 | 67.80 | 76.45 | 79.47 | 84.84 | 83.94 | 81.26 | 78.35 | 72.78 | 73.46 |
| Gujarat | 82.6 | 82.01 | 83.93 | 91.15 | 89.19 | 90.14 | 90.41 | 86.71 | 84.99 | 87.18 |
| Haryana | 127.6 | 142.72 | 148.03 | 147.25 | 146.29 | 139.08 | 142.80 | 147.74 | 143.51 | 145.47 |
| Himachal Pradesh | 123.2 | 131.81 | 160.26 | 153.58 | 152.22 | 154.67 | 153.88 | 156.20 | 157.24 | 167.04 |
| Jammu and Kashmir | 121.9 | 122.70 | 151.48 | 168.21 | 168.31 | 176.85 | 179.18 | 165.36 | 154.35 | 154.57 |
| Karnataka | 76.0 | 80.44 | 88.12 | 89.33 | 85.75 | 83.45 | 82.89 | 86.19 | 84.32 | 84.31 |
| Kerala | 175.4 | 194.85 | 262.27 | 276.03 | 260.45 | 251.64 | 263.11 | 256.62 | 270.62 | 265.25 |
| Madhya Pradesh | 70.6 | 73.85 | 71.21 | 73.25 | 73.40 | 77.30 | 74.22 | 69.92 | 65.71 | 65.89 |
| Maharashtra | 88.1 | 88.46 | 101.79 | 101.47 | 100.79 | 99.42 | 94.66 | 93.61 | 93.18 | 92.53 |
| Manipur | 72.5 | 77.72 | 87.30 | 79.51 | 78.45 | 87.44 | 88.06 | 83.23 | 81.01 | 84.03 |
| Meghalaya | 87.8 | 87.18 | 88.74 | 88.84 | 100.10 | 117.37 | 114.30 | 108.47 | 106.51 | 104.15 |
| Odisha | 65.8 | 63.26 | 70.31 | 74.02 | 84.78 | 82.46 | 83.00 | 85.15 | 77.16 | 73.50 |
| Punjab | 131.2 | 132.61 | 137.35 | 143.73 | 145.89 | 147.11 | 143.52 | 133.28 | 135.29 | 125.56 |
| Rajasthan | 129.5 | 122.60 | 147.47 | 177.44 | 155.53 | 131.67 | 128.34 | 127.32 | 105.18 | 121.67 |
| Tamil Nadu | 94.4 | 100.12 | 115.79 | 117.43 | 105.88 | 103.44 | 106.35 | 104.57 | 107.69 | 110.77 |
| Tripura | 69.5 | 74.55 | 77.89 | 86.27 | 87.61 | 100.56 | 97.95 | 108.42 | 109.39 | 103.05 |
| Uttar Pradesh | 81.2 | 87.45 | 92.97 | 94.69 | 91.99 | 92.28 | 90.74 | 87.32 | 83.09 | 88.22 |
| West Bengal | 69.9 | 78.99 | 84.50 | 85.59 | 87.29 | 84.17 | 84.10 | 90.49 | 93.51 | 92.71 |
| India | 95.0 | 98.33 | 93.51 | 96.31 | 95.09 | 96.55 | 96.05 | 95.99 | 94.45 | 94.53 |
| Sowing/Transplanting/Weeding (Male) | 2008–9 | 2009–10 | 2010–11 | 2011–12 | 2012–13 | 2013–14 | 2014–15 | 2015–16 | 2016–17 | |
| Andhra Pradesh | 109.94 | 122.11 | 140.44 | 153.09 | 146.10 | 129.64 | 143.30 | 145.24 | 145.16 | |
| Assam | 95.55 | 95.27 | 103.61 | 107.85 | 108.39 | 122.43 | 140.31 | 150.91 | 162.89 | |
| Bihar | 76.82 | 83.28 | 89.10 | 105.25 | 122.06 | 135.70 | 152.73 | 167.47 | 172.18 | |
| Gujarat | 87.41 | 79.45 | 80.81 | 93.55 | 93.43 | 106.43 | 122.25 | 122.72 | 126.83 | |
| Haryana | 154.84 | 172.03 | 177.66 | 173.89 | 172.68 | 208.80 | 222.53 | 249.56 | 216.02 | |
| Himachal Pradesh | 172.54 | 156.07 | 177.45 | 198.57 | 198.17 | 218.70 | 228.56 | 227.68 | 228.02 | |
| Jammu and Kashmir | 152.95 | 161.80 | 188.05 | 200.44 | 203.27 | 232.64 | 259.61 | 263.64 | 263.82 | |
| Karnataka | 82.66 | 84.22 | 95.11 | 107.98 | 123.07 | 135.73 | 138.14 | 148.99 | 152.33 | |
| Kerala | 266.51 | 278.99 | 308.47 | 354.19 | 372.45 | 358.48 | 363.42 | 373.62 | 367.14 | |
| Madhya Pradesh | 68.18 | 68.39 | 75.67 | 85.21 | 94.40 | 104.02 | 119.13 | 118.33 | 126.67 | |
| Maharashtra | 93.02 | 91.73 | 108.51 | 121.70 | 128.11 | 133.33 | 141.72 | 139.31 | 146.85 | |
| Manipur | 88.47 | 88.06 | 94.18 | 111.95 | 138.09 | 148.57 | 159.00 | 164.68 | 162.87 | |
| Meghalaya | 94.53 | 88.49 | 89.76 | 97.60 | 107.94 | 119.63 | 132.63 | 148.93 | 142.32 | |
| Odisha | 83.83 | 87.27 | 111.24 | 118.28 | 104.11 | 109.70 | 123.96 | 130.82 | 136.58 | |
| Punjab | 143.61 | 142.57 | 163.74 | 194.43 | 201.18 | 196.56 | 197.75 | 196.14 | 188.26 | |
| Rajasthan | 123.81 | 113.78 | 133.92 | 160.88 | 163.35 | 160.22 | 193.27 | 179.36 | 170.43 | |
| Tamil Nadu | 112.85 | 118.52 | 142.99 | 166.71 | 167.33 | 186.59 | 205.19 | 186.72 | 195.05 | |
| Tripura | 112.50 | 109.82 | 99.39 | 97.42 | 116.21 | 133.92 | 134.05 | 101.51 | 144.24 | |
| Uttar Pradesh | 92.21 | 95.63 | 106.92 | 117.08 | 127.06 | 133.78 | 138.61 | 138.67 | 144.22 | |
| West Bengal | 92.96 | 92.69 | 99.93 | 117.15 | 126.11 | 130.58 | 140.48 | 141.18 | 149.87 | |
| India | 96.91 | 98.54 | 109.36 | 121.06 | 128.00 | 142.06 | 153.43 | 154.49 | 158.55 |
Note: CPI-AL (2009–10=100) is used as a deflator.
Appendix Table 3 State–wise real wage rates for sowing/transplanting/weeding (female) occupations in rural India, 1998–2017 in Rupees
| Sowing/Transplanting/Weeding (Female) | 1998–99 | 1999–2000 | 2000–1 | 2001–2 | 2002–3 | 2003–4 | 2004–5 | 2005–6 | 2006–7 | 2007–8 |
| Andhra Pradesh | 52.20 | 55.46 | 57.59 | 56.69 | 53.89 | 54.04 | 55.24 | 57.27 | 61.02 | 69.59 |
| Assam | 83.49 | 87.42 | 89.75 | 79.19 | 80.38 | 80.29 | 82.95 | 83.03 | 85.41 | 84.60 |
| Bihar | 59.80 | 60.16 | 69.62 | 72.29 | 76.74 | 75.54 | 73.55 | 71.03 | 66.65 | 66.06 |
| Gujarat | 74.48 | 75.68 | 76.70 | 85.20 | 81.89 | 81.29 | 82.43 | 78.61 | 76.12 | 77.28 |
| Haryana | 106.52 | 130.73 | 123.84 | 138.90 | 137.03 | 128.76 | 129.93 | 140.68 | 138.14 | 136.60 |
| Himachal Pradesh | 117.36 | 125.20 | 133.84 | 119.92 | ||||||
| Jammu and Kashmir | 156.72 | 156.82 | ||||||||
| Karnataka | 55.74 | 58.18 | 64.52 | 63.92 | 61.59 | 58.73 | 60.10 | 61.05 | 59.06 | 61.26 |
| Kerala | 129.14 | 152.17 | 151.33 | 155.64 | 151.40 | 143.73 | 144.47 | 146.04 | 145.64 | 145.67 |
| Madhya Pradesh | 62.89 | 63.44 | 60.99 | 62.81 | 61.97 | 62.21 | 61.01 | 58.01 | 54.94 | 57.11 |
| Maharashtra | 67.58 | 60.60 | 65.99 | 67.54 | 66.35 | 64.62 | 60.38 | 61.05 | 62.02 | 60.74 |
| Manipur | 64.32 | 67.46 | 92.99 | 67.35 | 69.96 | 80.07 | 80.83 | 76.68 | 74.57 | 74.60 |
| Meghalaya | 68.22 | 63.43 | 60.64 | 62.52 | 72.40 | 79.26 | 78.90 | 78.53 | 76.53 | 72.15 |
| Odisha | 58.65 | 53.77 | 58.62 | 55.16 | 66.54 | 68.71 | 69.05 | 70.94 | 63.99 | 53.25 |
| Punjab | 111.52 | 115.26 | 123.80 | 140.09 | ||||||
| Rajasthan | 100.66 | 99.15 | 115.26 | 114.86 | 78.44 | 84.35 | 87.63 | 89.48 | 87.70 | 86.99 |
| Tamil Nadu | 60.97 | 69.55 | 67.46 | 64.01 | 59.62 | 61.33 | 62.78 | 63.89 | 65.68 | 67.72 |
| Tripura | 54.08 | 65.17 | ||||||||
| Uttar Pradesh | 65.15 | 73.48 | 80.14 | 77.72 | 77.47 | 80.32 | 77.46 | 72.45 | 70.81 | 76.67 |
| West Bengal | 63.31 | 71.64 | 77.33 | 78.73 | 80.74 | 78.64 | 78.09 | 83.38 | 84.10 | 82.80 |
| India | 78.23 | 83.28 | 75.37 | 75.67 | 75.12 | 74.29 | 74.32 | 74.11 | 73.16 | 75.14 |
| Sowing/Transplanting/Weeding (Female) | 2008–9 | 2009–10 | 2010–11 | 2011–12 | 2012–13 | 2013–14 | 2014–15 | 2015–16 | 2016–17 | |
| Andhra Pradesh | 84.34 | 93.97 | 107.02 | 114.53 | 115.62 | 104.86 | 105.60 | 105.76 | 114.79 | |
| Assam | 83.90 | 81.46 | 87.89 | 93.18 | 104.16 | 114.06 | 121.42 | 133.53 | 138.79 | |
| Bihar | 69.66 | 79.92 | 86.16 | 100.30 | 109.19 | 113.89 | 128.32 | 141.81 | 145.50 | |
| Gujarat | 78.62 | 72.38 | 73.23 | 87.88 | 85.81 | 100.90 | 116.57 | 115.61 | 121.83 | |
| Haryana | 146.49 | 166.33 | 172.62 | 168.34 | 170.08 | 201.81 | 211.36 | 241.03 | 206.61 | |
| Himachal Pradesh | 160.37 | 194.05 | 211.23 | 215.23 | ||||||
| Jammu and Kashmir | 252.16 | |||||||||
| Karnataka | 60.75 | 62.23 | 69.14 | 77.30 | 83.04 | 94.55 | 99.01 | 106.35 | 107.52 | |
| Kerala | 149.60 | 160.01 | 155.52 | 185.68 | 217.15 | 260.25 | 259.21 | 269.54 | 276.30 | |
| Madhya Pradesh | 57.53 | 56.57 | 68.78 | 76.50 | 81.35 | 91.47 | 111.24 | 110.86 | 118.64 | |
| Maharashtra | 58.96 | 66.20 | 72.97 | 81.06 | 84.31 | 93.44 | 97.97 | 92.50 | 97.04 | |
| Manipur | 79.40 | 81.87 | 87.50 | 99.76 | 110.72 | 141.68 | 141.88 | 141.77 | 135.82 | |
| Meghalaya | 66.90 | 63.39 | 69.06 | 69.90 | 75.59 | 89.55 | 97.76 | 106.58 | 105.92 | |
| Odisha | 65.36 | 69.59 | 100.48 | 107.22 | 91.28 | 92.05 | 99.34 | 107.01 | 113.62 | |
| Punjab | 153.02 | |||||||||
| Rajasthan | 105.76 | 83.09 | 105.41 | 141.84 | 140.80 | 120.96 | 135.28 | 148.77 | 152.95 | |
| Tamil Nadu | 74.63 | 83.12 | 100.35 | 116.51 | 114.24 | 117.05 | 128.44 | 120.57 | 123.25 | |
| Tripura | ||||||||||
| Uttar Pradesh | 78.90 | 80.26 | 90.59 | 100.41 | 107.20 | 109.09 | 119.31 | 121.29 | 126.31 | |
| West Bengal | 82.34 | 82.69 | 89.35 | 109.70 | 120.53 | 121.56 | 130.34 | 129.96 | 133.98 | |
| India | 78.18 | 81.71 | 91.28 | 102.99 | 109.09 | 117.55 | 124.87 | 126.28 | 131.24 |
Note: CPI-AL (2009–10=100) is used as a deflator.
Appendix Table 4 State–wise real wage rates for harvesting/threshing/winnowing (male) occupations in rural India, 1998–2017 in Rupees
| Harvesting/Threshing/Winnowing (Male) | 1998–99 | 1999–2000 | 2000–1 | 2001–2 | 2002–3 | 2003–4 | 2004–5 | 2005–6 | 2006–7 | 2007–8 |
| Andhra Pradesh | 79.90 | 82.12 | 84.31 | 81.84 | 79.91 | 81.05 | 78.42 | 87.70 | 92.63 | 104.08 |
| Assam | 81.31 | 80.76 | 85.65 | 88.07 | 88.90 | 100.48 | 97.07 | 94.20 | 95.50 | 96.57 |
| Bihar | 65.60 | 65.36 | 73.13 | 78.70 | 87.50 | 85.97 | 83.96 | 85.59 | 77.25 | 72.90 |
| Gujarat | 88.96 | 86.35 | 90.01 | 88.27 | 88.78 | 86.59 | 86.92 | 85.05 | 85.85 | 86.92 |
| Haryana | 132.13 | 151.76 | 154.87 | 154.13 | 153.62 | 150.19 | 152.70 | 160.40 | 153.70 | 152.37 |
| Himachal Pradesh | 126.40 | 126.88 | 141.49 | 141.39 | 149.30 | 152.02 | 149.90 | 141.69 | 164.72 | |
| Jammu and Kashmir | 128.29 | 118.27 | 156.64 | 168.36 | 167.21 | 173.26 | 167.18 | 165.04 | 153.45 | 149.49 |
| Karnataka | 73.86 | 74.51 | 82.59 | 83.74 | 79.06 | 76.87 | 78.70 | 81.13 | 80.52 | 83.88 |
| Kerala | 170.41 | 178.10 | 179.58 | 174.17 | 166.56 | |||||
| Madhya Pradesh | 71.10 | 71.67 | 73.13 | 75.98 | 74.06 | 73.72 | 73.14 | 71.34 | 66.05 | 68.40 |
| Maharashtra | 79.49 | 82.58 | 98.45 | 98.30 | 96.58 | 93.48 | 93.79 | 91.12 | 92.13 | 98.76 |
| Manipur | 80.62 | 77.54 | 87.52 | 89.80 | 71.95 | 86.94 | 86.55 | 81.87 | 79.54 | 82.81 |
| Meghalaya | 85.70 | 85.07 | 92.03 | 93.53 | 102.87 | 130.80 | 116.18 | 113.47 | 115.83 | 108.57 |
| Odisha | 70.22 | 61.06 | 71.46 | 69.58 | 79.84 | 77.02 | 81.73 | 82.28 | 73.94 | 70.88 |
| Punjab | 124.57 | 129.10 | 141.12 | 147.38 | 150.50 | 148.98 | 149.12 | 141.22 | 143.01 | 135.80 |
| Rajasthan | 141.17 | 133.84 | 144.09 | 143.51 | 110.68 | 117.48 | 109.10 | 113.41 | 100.15 | 110.04 |
| Tamil Nadu | 99.10 | 111.38 | 117.16 | 113.00 | 98.38 | 97.86 | 100.71 | 101.55 | 101.85 | 103.34 |
| Tripura | 69.45 | 74.52 | 77.81 | 86.27 | 86.03 | 104.45 | 97.95 | 108.42 | 109.39 | 103.05 |
| Uttar Pradesh | 81.84 | 87.46 | 91.72 | 89.21 | 91.45 | 91.83 | 90.08 | 87.52 | 83.25 | 87.37 |
| West Bengal | 67.05 | 76.99 | 82.13 | 81.96 | 84.27 | 83.40 | 83.69 | 91.04 | 93.55 | 92.74 |
| India | 94.42 | 96.91 | 91.41 | 93.06 | 91.95 | 90.56 | 90.93 | 93.53 | 91.99 | 93.12 |
| Harvesting/Threshing/Winnowing (Male) | 2008–9 | 2009–10 | 2010–11 | 2011–12 | 2012–13 | 2013–14 | 2014–15 | 2015–16 | 2016–17 | |
| Andhra Pradesh | 119.11 | 123.25 | 136.46 | 139.24 | 146.73 | 151.38 | 139.00 | 131.49 | 153.16 | |
| Assam | 95.09 | 94.72 | 107.95 | 112.37 | 123.03 | 130.93 | 146.92 | 149.20 | 161.11 | |
| Bihar | 77.88 | 82.38 | 84.36 | 101.24 | 111.53 | 126.63 | 149.85 | 160.54 | 158.18 | |
| Gujarat | 84.58 | 79.56 | 80.86 | 95.49 | 98.76 | 105.39 | 119.12 | 118.37 | 120.65 | |
| Haryana | 162.30 | 174.44 | 177.03 | 183.86 | 170.35 | 219.94 | 222.68 | 246.49 | 215.97 | |
| Himachal Pradesh | 166.45 | 162.16 | 178.97 | 206.24 | 204.53 | 221.60 | 228.27 | 221.15 | 220.75 | |
| Jammu and Kashmir | 149.48 | 159.14 | 184.99 | 203.22 | 200.48 | 230.28 | 261.77 | 269.19 | 267.05 | |
| Karnataka | 85.84 | 86.37 | 96.28 | 105.64 | 121.31 | 136.98 | 142.20 | 154.00 | 151.80 | |
| Kerala | 167.85 | 217.60 | 213.29 | 240.90 | 250.90 | 292.48 | 326.54 | 335.86 | 324.88 | |
| Madhya Pradesh | 70.25 | 74.23 | 81.22 | 86.72 | 103.07 | 112.31 | 130.62 | 130.79 | 134.49 | |
| Maharashtra | 98.72 | 98.04 | 104.59 | 127.40 | 140.78 | 150.44 | 141.31 | 138.02 | 146.33 | |
| Manipur | 88.96 | 91.33 | 98.88 | 115.99 | 136.83 | 160.62 | 169.41 | 166.99 | 162.68 | |
| Meghalaya | 92.98 | 98.69 | 97.74 | 98.06 | 117.59 | 145.45 | 138.29 | 169.53 | 183.00 | |
| Odisha | 82.15 | 89.91 | 112.42 | 129.90 | 119.13 | 125.72 | 128.32 | 129.02 | 139.51 | |
| Punjab | 147.12 | 144.31 | 182.02 | 213.45 | 213.09 | 203.01 | 191.83 | 197.88 | 203.00 | |
| Rajasthan | 131.07 | 136.86 | 154.76 | 147.41 | 160.88 | 178.97 | 208.54 | 191.47 | 170.65 | |
| Tamil Nadu | 107.70 | 122.88 | 138.85 | 158.94 | 134.68 | 197.66 | 234.83 | 218.94 | 215.37 | |
| Tripura | 112.50 | 109.82 | 99.35 | 97.32 | 116.21 | 135.77 | 134.05 | 101.51 | 144.24 | |
| Uttar Pradesh | 93.08 | 93.29 | 101.11 | 114.07 | 118.73 | 138.12 | 145.50 | 144.09 | 147.20 | |
| West Bengal | 92.43 | 90.71 | 99.50 | 120.49 | 128.97 | 134.43 | 141.38 | 142.95 | 151.61 | |
| India | 96.88 | 99.79 | 108.12 | 121.24 | 129.49 | 144.77 | 156.29 | 155.39 | 156.88 |
Note: CPI-AL (2009–10=100) is used as a deflator.
Appendix Table 5 State–wise real wage rates for harvesting/threshing/winnowing (female) occupations in rural India, 1998–2017 in Rupees
| Harvesting/Threshing/Winnowing (Female) | 1998–99 | 1999–2000 | 2000–1 | 2001–2 | 2002–3 | 2003–4 | 2004–5 | 2005–6 | 2006–7 | 2007–8 | 2008–9 |
| Andhra Pradesh | 64.83 | 65.08 | 66.33 | 67.12 | 58.18 | 58.84 | 58.96 | 65.24 | 68.56 | 75.20 | 91.80 |
| Assam | 89.64 | 81.31 | 83.19 | 87.66 | 80.69 | 82.81 | 86.43 | 87.36 | 92.43 | 85.38 | 81.04 |
| Bihar | 55.26 | 55.28 | 62.30 | 69.63 | 76.36 | 74.01 | 72.08 | 76.65 | 69.32 | 67.09 | 72.29 |
| Gujarat | 83.65 | 80.72 | 83.21 | 85.70 | 85.67 | 83.74 | 84.07 | 81.26 | 82.51 | 83.96 | 83.59 |
| Haryana | 126.68 | 139.30 | 156.36 | 151.87 | 157.58 | 156.60 | 159.57 | 157.88 | 149.91 | 151.59 | 158.89 |
| Himachal Pradesh | 114.60 | 122.33 | 138.64 | 137.96 | 157.34 | ||||||
| Jammu and Kashmir | 216.17 | 183.52 | |||||||||
| Karnataka | 56.47 | 56.48 | 62.41 | 62.59 | 59.57 | 57.47 | 57.23 | 59.43 | 61.63 | 65.50 | 64.16 |
| Kerala | 123.02 | 131.13 | 135.01 | 145.86 | 144.13 | 142.53 | 142.98 | 143.34 | 142.24 | 144.85 | 149.04 |
| Madhya Pradesh | 65.35 | 62.40 | 62.69 | 64.44 | 64.99 | 63.88 | 62.12 | 59.32 | 54.78 | 58.19 | 60.22 |
| Maharashtra | 58.96 | 56.36 | 68.71 | 67.51 | 65.77 | 60.80 | 59.84 | 57.23 | 60.45 | 62.25 | 61.94 |
| Manipur | 69.05 | 70.20 | 75.36 | 63.72 | 79.07 | 79.31 | 75.12 | 73.10 | 73.36 | 79.83 | |
| Meghalaya | 75.39 | 67.23 | 70.79 | 65.02 | 77.26 | 86.50 | 80.94 | 80.77 | 77.90 | 74.59 | 65.45 |
| Odisha | 60.31 | 52.08 | 60.32 | 56.49 | 65.48 | 62.10 | 65.10 | 71.15 | 53.33 | 51.18 | 68.91 |
| Punjab | 93.94 | 101.61 | 124.00 | 135.73 | 136.68 | ||||||
| Rajasthan | 129.28 | 123.46 | 123.46 | 113.51 | 81.73 | 93.07 | 93.25 | 99.34 | 88.20 | 97.18 | 120.45 |
| Tamil Nadu | 67.64 | 73.25 | 76.34 | 73.84 | 68.49 | 73.39 | 73.12 | 72.92 | 73.18 | 73.37 | 72.49 |
| Tripura | 54.08 | 63.24 | |||||||||
| Uttar Pradesh | 70.50 | 76.87 | 76.85 | 79.28 | 80.39 | 82.44 | 78.02 | 74.51 | 70.10 | 79.77 | 84.70 |
| West Bengal | 61.30 | 69.03 | 75.14 | 75.83 | 79.50 | 77.34 | 75.62 | 82.45 | 85.91 | 84.07 | 82.09 |
| India | 77.83 | 78.42 | 75.21 | 75.93 | 75.92 | 75.01 | 72.48 | 74.26 | 73.37 | 75.33 | 78.13 |
| Harvesting/Threshing/Winnowing (Female) | 2009–10 | 2010–11 | 2011–12 | 2012–13 | 2013–14 | 2014–15 | 2015–16 | 2016–17 | |||
| Andhra Pradesh | 94.74 | 108.85 | 105.67 | 109.05 | 102.16 | 107.65 | 99.49 | 119.47 | |||
| Assam | 79.32 | 86.35 | 91.87 | 108.62 | 117.64 | 127.74 | 127.66 | 133.86 | |||
| Bihar | 75.05 | 77.02 | 90.60 | 98.19 | 113.78 | 136.81 | 147.50 | 144.33 | |||
| Gujarat | 80.73 | 78.82 | 100.65 | 96.19 | 103.70 | 116.35 | 116.22 | 119.02 | |||
| Haryana | 165.98 | 173.34 | 180.00 | 169.81 | 216.64 | 224.20 | 242.61 | 215.39 | |||
| Himachal Pradesh | 219.44 | 223.74 | 0.00 | ||||||||
| Jammu and Kashmir | 311.35 | 0.00 | |||||||||
| Karnataka | 65.37 | 69.43 | 75.78 | 83.21 | 94.44 | 95.81 | 104.79 | 105.16 | |||
| Kerala | 161.67 | 161.31 | 179.79 | 205.25 | 236.04 | 251.60 | 248.02 | 257.94 | |||
| Madhya Pradesh | 63.81 | 74.42 | 78.81 | 89.39 | 98.01 | 120.28 | 122.19 | 122.18 | |||
| Maharashtra | 63.53 | 77.66 | 86.21 | 90.56 | 102.65 | 102.80 | 93.31 | 99.32 | |||
| Manipur | 83.49 | 92.88 | 104.92 | 123.21 | 140.04 | 150.43 | 151.27 | 146.74 | |||
| Meghalaya | 64.90 | 68.49 | 67.91 | 78.04 | 94.92 | 89.89 | 107.12 | 108.14 | |||
| Odisha | 73.92 | 81.52 | 81.20 | 93.52 | 114.43 | 105.90 | 109.35 | 120.20 | |||
| Punjab | 155.51 | 163.10 | 170.34 | ||||||||
| Rajasthan | 117.05 | 140.63 | 144.91 | 154.61 | 157.64 | 164.17 | 159.29 | 150.47 | |||
| Tamil Nadu | 83.52 | 101.02 | 109.95 | 98.03 | 132.33 | 152.45 | 133.48 | 120.36 | |||
| Tripura | 0.00 | ||||||||||
| Uttar Pradesh | 83.72 | 92.75 | 101.82 | 106.07 | 119.17 | 121.90 | 122.19 | 128.61 | |||
| West Bengal | 79.96 | 88.85 | 108.44 | 116.36 | 123.99 | 131.47 | 130.84 | 132.08 | |||
| India | 82.03 | 90.10 | 100.29 | 105.96 | 120.54 | 132.12 | 130.21 | 132.31 |
Note: CPI-AL (2009–10=100) is used as a deflator.
Appendix Table 6 State–wise real wage rates for carpenter (male) occupations in rural India, 1998–2017 in Rupees
| Carpenter (Male) | 1998–99 | 1999–2000 | 2000–1 | 2001–2 | 2002–3 | 2003–4 | 2004–5 | 2005–6 | 2006–7 | 2007–8 |
| Andhra Pradesh | 113.46 | 123.42 | 130.77 | 133.39 | 128.97 | 127.89 | 123.52 | 125.37 | 122.08 | 124.92 |
| Assam | 135.34 | 133.66 | 134.78 | 146.79 | 158.15 | 153.98 | 159.74 | 163.58 | 164.02 | 167.16 |
| Bihar | 110.06 | 114.41 | 133.46 | 141.73 | 157.32 | 155.47 | 155.36 | 146.59 | 136.34 | 136.96 |
| Gujarat | 194.76 | 191.09 | 199.35 | 204.09 | 203.62 | 200.18 | 203.07 | 194.50 | 184.33 | 181.74 |
| Haryana | 228.49 | 260.53 | 261.59 | 240.67 | 248.73 | 241.73 | 233.23 | 231.50 | 215.89 | 224.96 |
| Himachal Pradesh | 223.54 | 231.29 | 256.65 | 260.71 | 263.61 | 257.08 | 260.95 | 263.41 | 259.89 | 269.15 |
| Jammu and Kashmir | 256.58 | 248.63 | 260.14 | 265.44 | 260.31 | 260.88 | 270.41 | 263.10 | 246.74 | 239.65 |
| Karnataka | 117.85 | 137.71 | 160.83 | 166.85 | 163.27 | 154.13 | 147.50 | 154.11 | 147.96 | 148.14 |
| Kerala | 261.97 | 272.21 | 272.55 | 284.02 | 291.54 | 285.86 | 281.22 | 287.62 | 298.92 | 299.04 |
| Madhya Pradesh | 121.13 | 129.46 | 128.40 | 131.19 | 132.19 | 134.21 | 133.84 | 129.17 | 122.51 | 123.03 |
| Maharashtra | 141.35 | 150.45 | 158.00 | 165.88 | 167.44 | 163.12 | 161.02 | 158.09 | 152.79 | 154.43 |
| Manipur | 105.49 | 105.09 | 109.18 | 116.39 | 122.39 | 124.55 | 124.36 | 116.69 | 113.92 | 134.58 |
| Meghalaya | 147.37 | 145.31 | 146.47 | 141.53 | 163.29 | 158.80 | 165.45 | 181.97 | 176.30 | 170.20 |
| Odisha | 125.18 | 122.13 | 143.32 | 154.21 | 166.38 | 161.84 | 167.64 | 169.81 | 158.96 | 154.34 |
| Punjab | 270.48 | 272.04 | 284.49 | 276.11 | 272.07 | 266.49 | 260.29 | 254.76 | 245.40 | 240.00 |
| Rajasthan | 235.61 | 236.58 | 244.73 | 270.55 | 266.49 | 265.44 | 242.40 | 215.65 | 208.65 | 210.20 |
| Tamil Nadu | 158.12 | 171.83 | 187.93 | 188.33 | 175.57 | 174.97 | 186.43 | 183.62 | 182.62 | 184.09 |
| Tripura | 106.17 | 104.61 | 111.76 | 124.81 | 135.66 | 139.56 | 141.60 | 149.97 | 148.52 | 138.73 |
| Uttar Pradesh | 153.96 | 166.53 | 181.67 | 181.56 | 184.37 | 183.93 | 183.98 | 178.16 | 167.86 | 166.15 |
| West Bengal | 111.70 | 126.07 | 138.59 | 142.96 | 144.51 | 137.09 | 133.53 | 138.58 | 141.46 | 140.09 |
| India | 167.39 | 174.53 | 168.80 | 174.60 | 175.10 | 172.29 | 172.19 | 170.89 | 165.40 | 164.82 |
| Carpenter (Male) | 2008–9 | 2009–10 | 2010–11 | 2011–12 | 2012–13 | 2013–14 | 2014–15 | 2015–16 | 2016–17 | |
| Andhra Pradesh | 138.73 | 145.62 | 162.63 | 168.84 | 172.30 | 177.37 | 176.51 | 175.04 | 190.37 | |
| Assam | 167.82 | 156.18 | 155.99 | 167.89 | 178.48 | 207.14 | 215.02 | 217.42 | 222.43 | |
| Bihar | 138.53 | 140.01 | 152.43 | 166.99 | 184.32 | 202.35 | 212.10 | 223.69 | 232.52 | |
| Gujarat | 180.28 | 164.47 | 164.91 | 181.84 | 185.89 | 211.47 | 237.04 | 229.69 | 238.28 | |
| Haryana | 241.14 | 256.76 | 261.24 | 259.31 | 254.92 | 289.25 | 297.64 | 307.97 | 303.18 | |
| Himachal Pradesh | 262.52 | 257.47 | 263.19 | 283.35 | 288.75 | 318.69 | 320.42 | 325.11 | 331.37 | |
| Jammu and Kashmir | 245.60 | 246.83 | 267.47 | 288.67 | 289.41 | 314.60 | 344.74 | 342.34 | 339.93 | |
| Karnataka | 146.91 | 144.48 | 152.22 | 165.26 | 165.30 | 188.48 | 205.84 | 220.15 | 219.04 | |
| Kerala | 302.17 | 324.77 | 344.28 | 381.97 | 415.11 | 433.81 | 418.28 | 419.06 | 420.26 | |
| Madhya Pradesh | 117.15 | 113.46 | 120.05 | 124.66 | 124.81 | 137.67 | 158.61 | 165.25 | 177.32 | |
| Maharashtra | 150.60 | 148.34 | 162.90 | 167.15 | 174.61 | 193.55 | 199.65 | 198.88 | 197.22 | |
| Manipur | 139.63 | 136.39 | 140.61 | 159.11 | 181.34 | 194.02 | 214.40 | 219.23 | 210.69 | |
| Meghalaya | 163.64 | 154.90 | 158.74 | 152.35 | 153.06 | 165.86 | 177.19 | 183.32 | 183.97 | |
| Odisha | 152.27 | 147.56 | 159.46 | 177.48 | 190.77 | 188.88 | 200.21 | 221.26 | 232.33 | |
| Punjab | 238.18 | 228.17 | 259.11 | 282.17 | 296.08 | 294.39 | 296.70 | 294.55 | 284.09 | |
| Rajasthan | 222.54 | 216.85 | 224.80 | 251.08 | 259.17 | 265.79 | 278.52 | 268.00 | 257.31 | |
| Tamil Nadu | 192.01 | 221.81 | 250.69 | 285.74 | 300.34 | 308.29 | 315.84 | 306.73 | 299.51 | |
| Tripura | 144.69 | 139.58 | 126.70 | 123.22 | 151.11 | 193.30 | 198.09 | 188.45 | 205.20 | |
| Uttar Pradesh | 167.40 | 169.69 | 187.28 | 207.41 | 216.67 | 228.66 | 236.16 | 239.58 | 257.29 | |
| West Bengal | 135.67 | 126.52 | 130.84 | 140.78 | 156.06 | 179.66 | 194.31 | 201.38 | 209.70 | |
| India | 165.57 | 166.66 | 178.76 | 192.83 | 201.58 | 217.48 | 227.39 | 229.89 | 235.40 |
Note: CPI-RL (2009–10=100) is used as a deflator.
Appendix Table 7 State–wise real wage rates for blacksmith (male) occupations in rural India, 1998–2017 in Rupees
| Blacksmith (male) | 1998–99 | 1999–2000 | 2000–1 | 2001–2 | 2002–3 | 2003–4 | 2004–5 | 2005–6 | 2006–7 | 2007–8 |
| Andhra Pradesh | 95.70 | 107.95 | 115.94 | 118.09 | 115.06 | 113.61 | 109.12 | 106.87 | 101.55 | 104.71 |
| Assam | 86.64 | 88.34 | 90.12 | 100.97 | 107.97 | 115.77 | 116.75 | 115.04 | 111.31 | 104.95 |
| Bihar | 97.92 | 100.85 | 115.20 | 123.28 | 134.52 | 130.45 | 129.15 | 122.79 | 113.35 | 112.01 |
| Gujarat | 183.65 | 210.36 | 210.25 | 187.82 | 170.91 | |||||
| Haryana | 202.23 | 230.90 | 233.98 | 207.90 | 210.51 | 203.11 | 190.02 | 191.39 | 182.17 | 182.31 |
| Himachal Pradesh | 192.62 | 206.10 | 228.74 | 242.83 | 238.51 | 233.49 | 241.74 | 224.16 | 237.98 | 259.98 |
| Jammu and Kashmir | 189.15 | 171.00 | 175.36 | 186.78 | 187.88 | 190.22 | 187.29 | 191.87 | 180.96 | 184.53 |
| Karnataka | 99.20 | 109.59 | 129.44 | 135.21 | 128.55 | 118.29 | 117.38 | 120.57 | 112.82 | 110.73 |
| Kerala | 233.28 | 240.16 | 233.81 | 241.21 | 250.45 | 247.62 | 254.16 | 270.23 | 279.85 | 281.76 |
| Madhya Pradesh | 101.44 | 109.03 | 107.62 | 108.82 | 108.29 | 111.97 | 109.60 | 107.63 | 103.88 | 101.25 |
| Maharashtra | 118.80 | 123.08 | 134.33 | 136.96 | 134.76 | 133.52 | 134.92 | 135.21 | 125.17 | 126.42 |
| Manipur | 77.82 | 77.80 | 85.58 | 95.84 | 102.80 | 104.00 | 103.33 | 98.97 | 97.32 | 98.80 |
| Meghalaya | 109.78 | 100.21 | 104.76 | 110.01 | 119.18 | 126.61 | 123.81 | 124.35 | 118.64 | 122.37 |
| Odisha | 118.79 | 103.31 | 109.65 | 136.83 | 148.70 | 134.33 | 130.84 | 128.14 | 111.92 | 110.45 |
| Punjab | 263.73 | 268.93 | 278.96 | 266.15 | 268.16 | 259.63 | 254.79 | 261.52 | 245.20 | 236.13 |
| Rajasthan | 148.48 | 131.14 | 170.85 | 123.86 | 139.47 | |||||
| Tamil Nadu | 141.87 | 155.71 | 166.84 | 166.27 | 153.67 | 152.27 | 162.85 | 164.22 | 159.32 | 149.12 |
| Tripura | 46.83 | 51.76 | 54.07 | 65.11 | 67.39 | 76.07 | 87.05 | 97.00 | 99.49 | 92.85 |
| Uttar Pradesh | 139.09 | 143.87 | 156.07 | 155.88 | 156.96 | 163.48 | 162.44 | 158.80 | 150.02 | 148.95 |
| West Bengal | 85.63 | 100.82 | 110.39 | 105.16 | 108.84 | 103.46 | 94.36 | 87.02 | 88.80 | 90.81 |
| India | 137.39 | 142.71 | 133.50 | 135.82 | 135.61 | 134.74 | 133.36 | 132.59 | 126.68 | 124.74 |
| Blacksmith (male) | 2008–9 | 2009–10 | 2010–11 | 2011–12 | 2012–13 | 2013–14 | 2014–15 | 2015–16 | 2016–17 | |
| Andhra Pradesh | 107.48 | 113.40 | 126.24 | 135.15 | 135.45 | 136.59 | 142.76 | 138.67 | 146.33 | |
| Assam | 100.50 | 101.83 | 110.92 | 128.75 | 146.42 | 171.76 | 195.80 | 202.74 | 207.14 | |
| Bihar | 118.74 | 121.36 | 130.89 | 143.28 | 156.45 | 175.34 | 189.76 | 201.14 | 207.67 | |
| Gujarat | 144.00 | 159.01 | 150.15 | 156.47 | 170.75 | 180.44 | 181.84 | |||
| Haryana | 172.77 | 171.36 | 190.63 | 177.28 | 183.10 | 215.04 | ||||
| Himachal Pradesh | 251.02 | 241.99 | 251.61 | 265.05 | 262.28 | 270.71 | 260.03 | 264.10 | 280.38 | |
| Jammu and Kashmir | 172.02 | 185.01 | 243.62 | 274.65 | 274.93 | 313.63 | 316.83 | 312.66 | 304.07 | |
| Karnataka | 112.42 | 115.25 | 122.81 | 127.91 | 127.82 | 155.50 | 170.63 | 179.13 | 180.20 | |
| Kerala | 297.69 | 308.78 | 320.20 | 335.20 | 359.63 | 389.34 | 386.18 | 378.22 | 366.76 | |
| Madhya Pradesh | 98.25 | 94.15 | 101.34 | 110.86 | 112.93 | 123.02 | 143.88 | 153.80 | 167.29 | |
| Maharashtra | 122.99 | 122.60 | 136.21 | 143.78 | 154.63 | 169.47 | 176.80 | 174.56 | 177.23 | |
| Manipur | 97.98 | 97.82 | 105.24 | 118.68 | 146.72 | 171.00 | 188.66 | 188.86 | 185.16 | |
| Meghalaya | 120.29 | 132.50 | 139.32 | 133.12 | 142.86 | 155.35 | 163.25 | 161.43 | 160.11 | |
| Odisha | 105.84 | 95.73 | 98.16 | 113.00 | 112.88 | 118.87 | 126.82 | 145.88 | 158.54 | |
| Punjab | 225.77 | 216.08 | 240.02 | 258.94 | 270.45 | 293.63 | 295.70 | 287.74 | ||
| Rajasthan | 133.34 | 121.75 | 136.69 | 152.84 | 187.37 | 198.96 | 189.73 | 199.31 | 203.54 | |
| Tamil Nadu | 152.71 | 173.44 | 188.71 | 225.43 | 238.47 | 251.05 | 266.21 | 264.71 | 256.30 | |
| Tripura | 104.10 | 103.15 | 90.23 | 88.68 | 107.82 | 128.72 | 128.10 | 121.64 | 135.79 | |
| Uttar Pradesh | 144.51 | 146.93 | 160.53 | 173.17 | 182.16 | 197.23 | 212.32 | 213.33 | 231.79 | |
| West Bengal | 90.69 | 88.10 | 89.77 | 94.45 | 112.72 | 138.93 | 178.27 | 177.29 | 181.56 | |
| India | 122.75 | 125.17 | 134.92 | 146.94 | 155.13 | 172.78 | 187.05 | 189.73 | 194.18 |
Note: CPI-RL (2009–10=100) is used as a deflator.
Appendix Table 8 State–wise real wage rates for mason (male) occupations in rural India, 1998–2017 in Rupees
| Mason (Male) | 1998–99 | 1999–2000 | 2000–1 | 2001–2 | 2002–3 | 2003–4 | 2004–5 | 2005–6 | 2006–7 | 2007–8 |
| Andhra Pradesh | 134.85 | 144.74 | 154.14 | 155.92 | 153.84 | 156.90 | 153.62 | 155.65 | 152.34 | 166.67 |
| Assam | 136.73 | 138.39 | 139.44 | 156.22 | 160.64 | 165.74 | 172.02 | 175.33 | 173.76 | 173.41 |
| Bihar | 128.46 | 134.05 | 151.39 | 164.46 | 173.42 | 174.74 | 173.71 | 166.83 | 153.92 | 158.48 |
| Gujarat | 213.60 | 213.84 | 221.80 | 237.28 | 228.42 | 224.08 | 216.57 | 205.28 | 198.78 | 200.11 |
| Haryana | 252.13 | 278.16 | 286.99 | 286.94 | 285.22 | 279.48 | 282.52 | 280.85 | 273.83 | 275.93 |
| Himachal Pradesh | 225.99 | 231.49 | 254.94 | 256.51 | 258.88 | 259.98 | 262.24 | 256.68 | 251.16 | 260.80 |
| Jammu and Kashmir | 263.26 | 258.47 | 264.78 | 274.07 | 265.93 | 277.29 | 275.52 | 266.07 | 246.13 | 235.79 |
| Karnataka | 138.03 | 145.62 | 167.75 | 176.96 | 169.16 | 159.62 | 165.21 | 173.29 | 163.85 | 159.92 |
| Kerala | 255.52 | 264.80 | 267.15 | 280.61 | 278.05 | 270.49 | 273.65 | 286.22 | 290.37 | 296.95 |
| Madhya Pradesh | 151.90 | 156.81 | 154.58 | 157.96 | 157.49 | 161.44 | 158.75 | 154.42 | 146.17 | 148.00 |
| Maharashtra | 151.70 | 162.68 | 169.08 | 180.99 | 185.20 | 183.28 | 184.74 | 183.15 | 175.12 | 176.44 |
| Manipur | 108.07 | 108.13 | 111.41 | 119.24 | 120.35 | 123.25 | 123.00 | 117.47 | 115.43 | 106.88 |
| Meghalaya | 151.00 | 142.86 | 132.85 | 131.80 | 150.94 | 144.60 | 152.53 | 167.40 | 154.17 | 146.79 |
| Odisha | 136.72 | 136.93 | 155.57 | 166.95 | 177.82 | 176.79 | 178.24 | 173.42 | 163.56 | 157.13 |
| Punjab | 267.45 | 277.19 | 285.94 | 277.38 | 274.47 | 268.42 | 263.03 | 254.82 | 245.76 | 241.82 |
| Rajasthan | 251.42 | 252.51 | 265.20 | 266.35 | 261.82 | 272.47 | 249.32 | 228.46 | 223.93 | 231.78 |
| Tamil Nadu | 170.98 | 183.35 | 200.63 | 204.11 | 193.36 | 191.10 | 195.87 | 196.70 | 198.58 | 203.48 |
| Tripura | 106.14 | 104.50 | 111.46 | 124.81 | 132.10 | 141.31 | 141.60 | 149.97 | 148.86 | 138.95 |
| Uttar Pradesh | 171.58 | 186.54 | 201.83 | 202.88 | 204.68 | 203.40 | 203.30 | 194.01 | 185.00 | 182.05 |
| West Bengal | 113.79 | 130.54 | 145.41 | 148.40 | 151.88 | 147.27 | 142.33 | 145.05 | 148.03 | 144.71 |
| India | 177.78 | 184.56 | 183.87 | 189.82 | 189.37 | 188.51 | 187.78 | 185.76 | 179.82 | 181.05 |
| Mason (Male) | 2008–9 | 2009–10 | 2010–11 | 2011–12 | 2012–13 | 2013–14 | 2014–15 | 2015–16 | 2016–17 | |
| Andhra Pradesh | 184.05 | 191.99 | 207.55 | 208.53 | 210.98 | 211.63 | 221.44 | 222.56 | 239.15 | |
| Assam | 171.44 | 159.55 | 161.99 | 178.66 | 192.73 | 213.13 | 234.44 | 241.19 | 240.78 | |
| Bihar | 158.69 | 158.43 | 171.15 | 199.14 | 216.55 | 229.18 | 235.98 | 248.11 | 255.44 | |
| Gujarat | 209.47 | 180.23 | 184.38 | 218.13 | 233.76 | 242.83 | 270.81 | 262.13 | 262.67 | |
| Haryana | 285.13 | 278.86 | 304.71 | 285.53 | 275.06 | 305.61 | 326.47 | 336.62 | 337.73 | |
| Himachal Pradesh | 248.79 | 250.16 | 264.59 | 284.50 | 285.73 | 319.36 | 327.23 | 321.80 | 327.93 | |
| Jammu and Kashmir | 242.23 | 241.98 | 265.19 | 285.89 | 286.47 | 313.18 | 342.74 | 335.46 | 341.29 | |
| Karnataka | 164.09 | 158.96 | 168.43 | 174.10 | 171.79 | 200.65 | 210.60 | 211.89 | 216.33 | |
| Kerala | 300.56 | 322.94 | 342.43 | 384.20 | 414.68 | 436.80 | 424.51 | 429.34 | 428.32 | |
| Madhya Pradesh | 143.21 | 134.99 | 139.60 | 144.71 | 155.76 | 171.17 | 188.30 | 200.50 | 216.11 | |
| Maharashtra | 179.93 | 170.86 | 186.06 | 189.34 | 215.74 | 232.08 | 231.40 | 238.36 | 237.16 | |
| Manipur | 165.06 | 161.20 | 146.38 | 167.31 | 199.15 | 205.96 | 227.84 | 229.42 | 224.66 | |
| Meghalaya | 143.15 | 142.09 | 155.28 | 160.97 | 163.95 | 175.29 | 189.73 | 182.85 | 182.58 | |
| Odisha | 158.98 | 156.33 | 170.03 | 190.58 | 204.89 | 202.45 | 214.96 | 233.67 | 244.62 | |
| Punjab | 236.33 | 228.56 | 263.06 | 283.44 | 296.85 | 298.66 | 302.41 | 306.03 | 295.71 | |
| Rajasthan | 242.01 | 239.00 | 246.41 | 270.32 | 305.50 | 319.37 | 331.55 | 336.22 | 336.56 | |
| Tamil Nadu | 217.64 | 251.51 | 279.24 | 304.32 | 318.81 | 333.66 | 336.40 | 327.06 | 318.30 | |
| Tripura | 143.59 | 135.83 | 123.85 | 125.08 | 152.42 | 218.41 | 227.32 | 218.17 | 220.23 | |
| Uttar Pradesh | 180.56 | 188.77 | 214.29 | 243.20 | 250.81 | 258.27 | 267.10 | 274.30 | 292.07 | |
| West Bengal | 141.00 | 131.29 | 134.95 | 155.45 | 174.59 | 196.61 | 208.21 | 212.64 | 228.04 | |
| India | 183.55 | 182.92 | 195.81 | 211.65 | 224.16 | 240.48 | 251.29 | 254.74 | 261.09 |
Note: CPI-RL (2009–10=100) is used as a deflator.
Appendix Table 9 State–wise real wage rates for unskilled labour (male) occupations in rural India, 1998–2017 in Rupees
| Unskilled labour (male) | 1998–99 | 1999–2000 | 2000–1 | 2001–2 | 2002–3 | 2003–4 | 2004–5 | 2005–6 | 2006–7 | 2007–8 |
| Andhra Pradesh | 73.19 | 79.18 | 82.14 | 81.28 | 78.20 | 78.02 | 76.92 | 78.83 | 79.42 | 89.01 |
| Assam | 70.79 | 76.79 | 81.14 | 86.33 | 87.02 | 93.19 | 97.48 | 94.58 | 93.69 | 93.41 |
| Bihar | 62.75 | 63.87 | 72.06 | 78.42 | 81.03 | 81.52 | 81.98 | 79.75 | 75.03 | 77.09 |
| Gujarat | 79.77 | 75.93 | 78.05 | 83.62 | 84.53 | 83.29 | 78.64 | 74.13 | 73.24 | 78.53 |
| Haryana | 131.93 | 138.25 | 154.66 | 155.15 | 153.24 | 149.24 | 144.61 | 145.13 | 141.39 | 148.59 |
| Himachal Pradesh | 121.55 | 127.64 | 144.83 | 149.91 | 149.61 | 149.71 | 152.75 | 149.25 | 142.23 | 150.38 |
| Jammu and Kashmir | 146.01 | 137.90 | 146.54 | 152.20 | 152.49 | 162.21 | 163.40 | 155.54 | 146.71 | 147.32 |
| Karnataka | 64.42 | 64.70 | 72.79 | 74.47 | 73.65 | 70.84 | 71.36 | 75.58 | 72.86 | 74.17 |
| Kerala | 191.63 | 200.60 | 199.97 | 211.13 | 213.72 | 211.63 | 208.67 | 210.50 | 217.46 | 219.04 |
| Madhya Pradesh | 59.63 | 63.65 | 61.81 | 61.22 | 62.04 | 62.33 | 60.74 | 59.23 | 55.32 | 56.58 |
| Maharashtra | 79.02 | 79.09 | 81.35 | 84.73 | 83.25 | 82.32 | 80.51 | 78.54 | 78.05 | 78.55 |
| Manipur | 68.46 | 65.86 | 69.86 | 71.39 | 69.85 | 77.07 | 77.39 | 73.38 | 71.21 | 73.66 |
| Meghalaya | 80.89 | 76.65 | 75.46 | 77.43 | 89.46 | 89.02 | 93.51 | 103.10 | 102.96 | 99.19 |
| Odisha | 62.19 | 59.44 | 66.37 | 67.67 | 74.98 | 73.45 | 73.56 | 76.51 | 75.20 | 72.66 |
| Punjab | 138.31 | 140.58 | 145.56 | 145.23 | 144.50 | 142.12 | 137.53 | 131.06 | 134.16 | 133.66 |
| Rajasthan | 113.02 | 116.83 | 125.34 | 127.82 | 122.93 | 126.27 | 115.60 | 108.49 | 105.43 | 113.12 |
| Tamil Nadu | 89.98 | 103.05 | 111.53 | 112.47 | 104.25 | 106.03 | 108.42 | 110.80 | 114.57 | 114.94 |
| Tripura | 72.11 | 75.49 | 79.08 | 87.17 | 89.08 | 99.95 | 100.25 | 110.43 | 111.76 | 104.21 |
| Uttar Pradesh | 83.96 | 87.88 | 94.07 | 93.42 | 93.04 | 93.67 | 93.16 | 88.14 | 85.25 | 89.77 |
| West Bengal | 64.32 | 73.11 | 80.39 | 81.64 | 83.04 | 80.85 | 79.04 | 82.87 | 82.18 | 81.54 |
| India | 93.98 | 97.00 | 91.89 | 94.00 | 93.99 | 93.99 | 93.20 | 92.58 | 90.81 | 92.81 |
| Unskilled labour (male) | 2008–9 | 2009–10 | 2010–11 | 2011–12 | 2012–13 | 2013–14 | 2014–15 | 2015–16 | 2016–17 | |
| Andhra Pradesh | 105.24 | 104.74 | 117.97 | 128.45 | 128.58 | 139.94 | 139.69 | 132.69 | 136.49 | |
| Assam | 99.88 | 97.40 | 105.75 | 111.30 | 114.96 | 134.95 | 135.93 | 147.27 | 150.35 | |
| Bihar | 79.81 | 90.12 | 97.88 | 108.11 | 119.26 | 135.38 | 145.62 | 152.04 | 157.16 | |
| Gujarat | 81.84 | 73.75 | 72.66 | 85.34 | 87.59 | 106.38 | 121.66 | 119.72 | 124.04 | |
| Haryana | 158.20 | 171.03 | 181.88 | 183.18 | 185.22 | 210.56 | 220.53 | 219.20 | 212.56 | |
| Himachal Pradesh | 153.35 | 147.92 | 159.14 | 176.45 | 173.37 | 184.66 | 173.46 | 175.49 | 195.52 | |
| Jammu and Kashmir | 153.35 | 162.85 | 186.53 | 210.97 | 218.29 | 246.69 | 268.34 | 269.68 | 260.79 | |
| Karnataka | 77.63 | 79.98 | 86.41 | 96.58 | 97.37 | 119.29 | 130.49 | 129.50 | 126.18 | |
| Kerala | 231.81 | 254.26 | 264.79 | 299.54 | 325.97 | 363.52 | 362.88 | 344.85 | 329.30 | |
| Madhya Pradesh | 58.46 | 58.89 | 66.85 | 74.01 | 76.93 | 91.14 | 107.82 | 112.57 | 124.03 | |
| Maharashtra | 81.69 | 80.96 | 91.94 | 97.60 | 103.94 | 125.95 | 133.82 | 128.00 | 128.85 | |
| Manipur | 79.36 | 78.15 | 75.03 | 85.79 | 106.92 | 111.82 | ||||
| Meghalaya | 93.00 | 90.88 | 94.46 | 99.38 | 109.23 | 122.51 | 129.78 | 129.17 | 133.80 | |
| Odisha | 78.96 | 83.42 | 101.57 | 115.40 | 115.62 | 113.73 | 112.29 | 126.78 | 141.07 | |
| Punjab | 145.50 | 144.32 | 167.82 | 179.22 | 189.37 | 195.31 | 183.73 | 189.63 | 189.46 | |
| Rajasthan | 128.03 | 125.67 | 141.53 | 160.27 | 168.93 | 173.06 | 184.48 | 186.26 | 181.20 | |
| Tamil Nadu | 125.04 | 140.81 | 155.55 | 170.08 | 170.02 | 210.20 | 230.67 | 214.55 | 210.51 | |
| Tripura | 116.87 | 111.20 | 101.68 | 103.06 | 125.01 | 128.59 | 127.80 | 121.58 | 135.79 | |
| Uttar Pradesh | 97.55 | 101.12 | 112.73 | 124.33 | 131.21 | 144.43 | 143.61 | 140.72 | 149.47 | |
| West Bengal | 83.58 | 81.87 | 90.34 | 106.06 | 115.93 | 129.90 | 147.55 | 156.55 | 170.47 | |
| India | 98.96 | 101.86 | 112.63 | 124.32 | 129.57 | 148.50 | 156.33 | 156.08 | 159.50 |
Note: CPI-RL (2009–10=100) is used as a deflator.
Appendix Table 10 State–wise real wage rates for unskilled labour (female) occupations in rural India, 1998–2017 in Rupees
| Unskilled (Female) | 1998–99 | 1999–2000 | 2000–1 | 2001–2 | 2002–3 | 2003–4 | 2004–5 | 2005–6 | 2006–7 | 2007–8 |
| Andhra Pradesh | 53.41 | 55.95 | 58.08 | 59.65 | 58.08 | 57.55 | 54.63 | 57.06 | 57.72 | 64.36 |
| Assam | 63.07 | 66.54 | 70.64 | 72.61 | 72.34 | 69.21 | 69.56 | 63.73 | 65.47 | 71.54 |
| Bihar | 54.62 | 55.30 | 63.24 | 66.76 | 73.91 | 73.81 | 73.23 | 72.63 | 66.37 | 67.98 |
| Gujarat | 73.77 | 68.93 | 74.33 | 79.04 | 82.54 | 80.66 | 75.27 | 70.96 | 70.37 | 75.69 |
| Haryana | 115.26 | 123.28 | 142.86 | 143.68 | 142.84 | 142.40 | 138.94 | 139.86 | 134.17 | 138.08 |
| Himachal Pradesh | 100.14 | 105.78 | ||||||||
| Jammu and Kashmir | 150.57 | |||||||||
| Karnataka | 48.95 | 47.96 | 54.12 | 56.06 | 54.74 | 53.15 | 52.52 | 53.79 | 52.83 | 54.71 |
| Kerala | 127.00 | 139.92 | 139.15 | 153.29 | 150.12 | 151.95 | 157.45 | 163.80 | 170.25 | 167.84 |
| Madhya Pradesh | 53.00 | 56.68 | 53.86 | 52.90 | 52.43 | 52.77 | 51.51 | 50.63 | 47.60 | 49.00 |
| Maharashtra | 55.06 | 54.05 | 53.64 | 54.53 | 54.13 | 52.83 | 51.37 | 49.99 | 49.26 | 51.30 |
| Manipur | 60.95 | 61.55 | 62.49 | 66.66 | 67.23 | 72.16 | 72.40 | 66.98 | 64.58 | 64.44 |
| Meghalaya | 70.18 | 64.24 | 62.94 | 70.24 | 67.52 | 64.38 | 65.32 | |||
| Odisha | 54.84 | 53.34 | 59.67 | 60.46 | 66.89 | 63.88 | 62.41 | 64.21 | 62.34 | 60.03 |
| Punjab | 90.03 | 97.60 | 139.76 | 131.69 | 115.54 | 109.53 | ||||
| Rajasthan | 98.38 | 98.83 | 109.16 | 110.44 | 106.51 | 110.81 | 103.52 | 97.12 | 96.17 | 101.13 |
| Tamil Nadu | 59.97 | 68.50 | 74.66 | 76.35 | 70.54 | 72.13 | 74.98 | 76.63 | 81.45 | 85.71 |
| Tripura | 65.54 | 72.42 | 87.17 | 101.70 | ||||||
| Uttar Pradesh | 68.82 | 71.83 | 75.55 | 72.21 | 76.68 | 79.77 | 78.53 | 72.85 | 70.75 | 74.76 |
| West Bengal | 56.65 | 63.18 | 72.56 | 74.50 | 73.78 | 72.63 | 71.85 | 74.61 | 72.72 | 72.26 |
| India | 74.06 | 76.48 | 68.70 | 70.16 | 70.67 | 70.23 | 69.09 | 69.45 | 68.03 | 70.31 |
| Unskilled (Female) | 2008–9 | 2009–10 | 2010–11 | 2011–12 | 2012–13 | 2013–14 | 2014–15 | 2015–16 | 2016–17 | |
| Andhra Pradesh | 75.49 | 78.21 | 86.37 | 93.20 | 92.71 | 103.71 | 93.41 | 88.32 | 94.50 | |
| Assam | 73.28 | 73.58 | 81.91 | 84.86 | 95.35 | 118.98 | 132.19 | 140.47 | 152.05 | |
| Bihar | 72.84 | 80.64 | 90.72 | 98.11 | 102.58 | 121.77 | 127.88 | 128.43 | 130.55 | |
| Gujarat | 79.96 | 71.78 | 70.09 | 83.25 | 83.56 | 107.53 | 125.33 | 122.69 | 128.83 | |
| Haryana | 155.35 | 169.05 | 174.52 | 178.88 | 172.56 | 193.58 | ||||
| Himachal Pradesh | 161.84 | 155.75 | 162.60 | 195.45 | 195.74 | 192.72 | ||||
| Jammu and Kashmir | ||||||||||
| Karnataka | 57.89 | 57.76 | 61.55 | 68.88 | 70.51 | 88.69 | 91.87 | 97.86 | 100.26 | |
| Kerala | 170.98 | 188.71 | 184.92 | 201.65 | 218.94 | 226.06 | ||||
| Madhya Pradesh | 50.40 | 52.29 | 59.69 | 64.48 | 69.19 | 77.01 | 84.81 | 88.88 | 106.96 | |
| Maharashtra | 52.79 | 52.96 | 60.12 | 66.87 | 70.92 | 75.28 | 83.62 | 81.66 | 82.06 | |
| Manipur | 69.82 | 69.09 | 71.40 | 82.50 | 101.31 | 103.77 | ||||
| Meghalaya | 63.03 | 61.23 | 65.73 | 71.49 | 72.82 | 72.43 | ||||
| Odisha | 66.88 | 73.09 | 91.09 | 104.83 | 105.29 | 104.70 | 106.14 | 116.52 | 126.75 | |
| Punjab | ||||||||||
| Rajasthan | 116.80 | 117.29 | 129.08 | 148.36 | 158.09 | 159.02 | 178.97 | 176.16 | ||
| Tamil Nadu | 90.88 | 105.16 | 111.98 | 123.15 | 125.92 | 148.90 | 159.70 | 148.27 | 145.09 | |
| Tripura | ||||||||||
| Uttar Pradesh | 79.37 | 80.75 | 92.24 | 103.92 | 110.68 | 122.42 | 122.90 | 122.08 | 130.94 | |
| West Bengal | 75.25 | 73.58 | 82.25 | 92.38 | 101.79 | 115.72 | 128.49 | 133.03 | 141.18 | |
| India | 75.18 | 77.69 | 85.77 | 95.18 | 99.53 | 112.35 | 114.58 | 114.51 | 119.92 |
Note: CPI-RL (2009–10=100) is used as a deflator.