Introduction
The Mahatma Gandhi National Rural Employment Guarantee Scheme (MGNREGS) is the largest public works programme in India. It came into being as a consequence of the enactment of the National Rural Employment Guarantee Act (NREGA) in 2005.1 The Scheme was started in 2005–06 in 200 districts, extended to another 130 districts in 2007–08, and to all the remaining 285 rural districts in 2008–09. All rural families are entitled to apply for participation in the Scheme and to get job cards issued. Workers in families that obtain job cards are entitled to guaranteed employment in public works for up to 100 days per family in a year. The government is obliged to provide employment within 15 days of the demand for it. In case of failure to provide employment, the government is obliged to pay an unemployment allowance.
According to the Ministry of Rural Development (MoRD), 119.8 million rural households were issued MGNREGS job cards in 2010–11 (MoRD 2012a). With a budget outlay of Rs 401 billion and an expenditure of Rs 256.9 billion on wages, employment was provided to 54.9 million households. A total of 2571.5 million person-days of total employment and 47 person-days of employment per household were provided in 2010–11 under the Scheme. The average wage paid was reported as Rs 99.90 per day (ibid.).
There have been a number of studies of the performance of the MGNREGS, based on both official statistics as well as primary data. Since extensive reviews of this body of literature are already available (see, for example, Khera 2011 and MoRD 2012b), we shall not attempt to summarise the results of these studies here.
This note compares household-level data from the 66th Round of the Survey of Employment and Unemployment of the National Sample Survey Organisation (NSSO) with data from the Management Information System (MIS) of MGNREGS of the Ministry of Rural Development, Government of India (http://nrega.nic.in/netnrega/MISreport1.aspx), to identify discrepancies in respect of extent of registration of rural households under MGNREGS, the proportion of rural households that sought work under MGNREGS, the proportion of rural households that were provided employment under the Scheme, and the number days of employment provided to rural households. The note does not deal with issues related to public expenditure, or to financial aspects of the implementation of MGNREGS and its impact on rural labour markets.
Job Cards Issued Under MGNREGS
As per the guidelines of the MGNREGS, those who want employment under the Scheme are required to apply in writing or orally at a gram panchayat. After verification of the application, a job card is issued to the applicant within 14 days.
The NSSO data presented in Table 1 show that in 2009–10, 34.7 per cent of about 163 million rural households had MGNREGS job cards. The table also shows that there was a large variation across States in terms of the proportion of households with job cards, ranging from 6.6 per cent in Haryana to 80 per cent in Tripura and 91.2 per cent in Mizoram. The North-Eastern States, in particular Mizoram, Tripura, and Manipur, are noteworthy for the high proportion of rural households that were given job cards. Among other States, the coverage in terms of households with job cards was high in Rajasthan, Madhya Pradesh, West Bengal, and Chhattisgarh. The proportion of households with job cards was the lowest in Haryana, Punjab, Maharashtra, Karnataka, Bihar, and Jammu & Kashmir.
Table 1 Households with MGNREGS job cards as a proportion of total number of rural households, 2009-10 in per cent
| State | Proportion of households with job cards |
| Andhra Pradesh | 43 |
| Arunachal Pradesh | 22 |
| Assam | 29 |
| Bihar | 17 |
| Chhattisgarh | 59 |
| Gujarat | 30 |
| Haryana | 7 |
| Himachal Pradesh | 45 |
| Jammu & Kashmir | 19 |
| Jharkhand | 30 |
| Karnataka | 15 |
| Kerala | 20 |
| Madhya Pradesh | 69 |
| Maharashtra | 13 |
| Manipur | 73 |
| Meghalaya | 49 |
| Mizoram | 91 |
| Nagaland | 67 |
| Odisha | 40 |
| Punjab | 9 |
| Rajasthan | 71 |
| Sikkim | 46 |
| Tamil Nadu | 40 |
| Tripura | 80 |
| Uttar Pradesh | 21 |
| Uttarakhand | 34 |
| West Bengal | 59 |
| India | 35 |
Source: Based on data from the Survey of Employment and Unemployment, National Sample Survey, 66th Round.
Table 2 presents data on the proportion of households belonging to different caste groups that had job cards. As may be expected, overall, the proportion of Dalit and Adivasi rural households having job cards was higher than the proportion of rural households belonging to OBC (Other Backward Classes) and Other castes with job cards. It is, however, surprising to see that in some States, the proportion of job card holders among Adivasis and Dalits was very low: only 12.3 per cent of Dalit households in Maharashtra, 13.4 per cent of Dalit households in Haryana, and 14.6 per cent of Dalit households in Punjab had job cards. In States where the overall proportion of rural households with job cards was high, this proportion was high across all social groups.
Table 2 Proportion of households with job cards, by caste group, 2009-10 in per cent
| State | Adivasi | Dalit | OBC | Others | All |
| Andhra Pradesh | 69.4 | 53.2 | 47.3 | 17.4 | 43.4 |
| Arunachal Pradesh | 26.0 | 11.6 | 18.8 | 9.7 | 21.8 |
| Assam | 30.0 | 30.6 | 24.6 | 30.4 | 28.7 |
| Bihar | 29.4 | 28.5 | 15.3 | 5.3 | 17.2 |
| Chhattisgarh | 61.3 | 63.9 | 58.4 | 37.8 | 58.9 |
| Gujarat | 45.0 | 47.7 | 26.6 | 10.8 | 30.2 |
| Haryana | – | 13.4 | 6.1 | 2.0 | 6.6 |
| Himachal Pradesh | 54.3 | 56.1 | 38.0 | 41.0 | 45.4 |
| Jammu & Kashmir | 36.8 | 25.7 | 20.1 | 16.6 | 19.0 |
| Jharkhand | 39.1 | 35.8 | 22.7 | 20.7 | 30.4 |
| Karnataka | 30.0 | 22.1 | 10.6 | 13.2 | 15.1 |
| Kerala | 34.4 | 35.1 | 18.5 | 14.9 | 19.6 |
| Madhya Pradesh | 74.0 | 68.8 | 68.5 | 58.2 | 68.8 |
| Maharashtra | 21.4 | 12.3 | 16.2 | 7.5 | 13.4 |
| Manipur | 86.0 | 98.1 | 60.6 | 55.3 | 72.7 |
| Meghalaya | 49.0 | 70.9 | 48.9 | 40.1 | 48.8 |
| Mizoram | 91.3 | 89.2 | – | – | 91.2 |
| Nagaland | 69.5 | – | – | 6.5 | 66.6 |
| Odisha | 50.3 | 41.3 | 44.0 | 23.0 | 40.4 |
| Punjab | – | 14.6 | 4.3 | 3.7 | 8.6 |
| Rajasthan | 82.8 | 74.4 | 68.4 | 59.6 | 70.9 |
| Sikkim | 55.2 | 30.9 | 48.3 | 2.3 | 45.8 |
| Tamil Nadu | 29.3 | 56.5 | 34.8 | 9.9 | 39.6 |
| Tripura | 88.4 | 83.1 | 81.4 | 65.1 | 80.1 |
| Uttar Pradesh | 14.0 | 39.7 | 16.2 | 7.3 | 21.1 |
| Uttarakhand | 47.1 | 57.2 | 12.1 | 32.7 | 34.3 |
| West Bengal | 75.8 | 72.1 | 60.9 | 50.1 | 59.2 |
| India | 54.1 | 45.0 | 30.6 | 24.0 | 34.7 |
Source: Based on data from the Survey of Employment and Unemployment, National Sample Survey, 66th Round.
Table 3 shows that in 2009–10, about 48 per cent of rural labour households had MGNREGS job cards. The proportion was the highest in Mizoram, where almost all rural labour households had job cards. In Tripura about 90 per cent of rural labour households had job cards. The proportion of job card holders among rural labour households was high also in Rajasthan (84.5 per cent), Madhya Pradesh (79.2 per cent), and West Bengal (75.7 per cent). In contrast, only about 15 per cent of rural labour households in Haryana, 17 per cent in Punjab, and 18 per cent in Maharashtra had job cards.
Table 3 Proportion of rural households with job cards, by type of household, 2009-10 in per cent
| State | Rural labour households | Households self-employed in agriculture | Other households | All households |
| Andhra Pradesh | 58.7 | 47.0 | 16.1 | 43.4 |
| Arunachal Pradesh | 24.2 | 29.4 | 9.3 | 21.8 |
| Assam | 42.1 | 30.0 | 16.8 | 28.6 |
| Bihar | 26.9 | 8.1 | 11.8 | 17.2 |
| Chhattisgarh | 66.8 | 61.7 | 33.0 | 58.9 |
| Gujarat | 39.4 | 29.7 | 11.5 | 30.0 |
| Haryana | 15.4 | 3.0 | 2.7 | 6.6 |
| Himachal Pradesh | 62.3 | 52.9 | 22.3 | 45.4 |
| Jammu & Kashmir | 38.6 | 20.7 | 10.3 | 19.0 |
| Jharkhand | 40.4 | 32.2 | 15.4 | 30.3 |
| Karnataka | 23.5 | 8.3 | 6.0 | 15.1 |
| Kerala | 32.2 | 13.9 | 8.8 | 19.6 |
| Madhya Pradesh | 79.2 | 67.9 | 40.1 | 68.8 |
| Maharashtra | 18.2 | 11.5 | 6.9 | 13.4 |
| Manipur | 71.2 | 85.1 | 58.2 | 72.7 |
| Meghalaya | 57.1 | 62.6 | 26.3 | 48.8 |
| Mizoram | 99.7 | 99.8 | 67.6 | 91.2 |
| Nagaland | 73.1 | 84.0 | 41.2 | 66.6 |
| Odisha | 54.3 | 42.1 | 22.4 | 40.4 |
| Punjab | 17.6 | 1.9 | 2.8 | 8.6 |
| Rajasthan | 84.5 | 73.8 | 49.1 | 70.9 |
| Sikkim | 31.7 | 87.6 | 11.7 | 45.8 |
| Tamil Nadu | 50.5 | 38.4 | 14.3 | 39.6 |
| Tripura | 89.8 | 92.0 | 62.2 | 80.1 |
| Uttar Pradesh | 39.6 | 14.4 | 11.7 | 21.1 |
| Uttarakhand | 52.9 | 54.5 | 11.9 | 34.3 |
| West Bengal | 75.7 | 49.2 | 39.1 | 59.2 |
| Other | 32.8 | 47.1 | 4.7 | 19.5 |
| Total | 47.7 | 32.5 | 18.2 | 34.7 |
Source: Based on data from the Survey of Employment and Unemployment, National Sample Survey, 66th Round.
Table 3 also shows that in States where the MGNREGS was implemented well, a substantial proportion of households that were self-employed in agriculture had also enrolled in the Scheme.
A comparison of data from the NSSO Survey and administrative statistics from the MIS shows that there is a large gap between the number of households that were reported to have job cards and the total number of job cards that were issued (Table 4). According to the NSS data, 56.5 million households had job cards, whereas the MIS data show that a total of 116.4 million job cards had been issued until 2009–10. In Bihar and Karnataka, the total number of job cards that the claimed to have been issued by the government was more than four times the NSSO estimate of the number of households with job cards.2
Table 4 Number of rural households with job cards, National Sample Survey and Management Information System of the Ministry of Rural Development, 2009–10
| State |
Management Information System of
the Ministry of Rural Development |
National Sample Survey |
| Andhra Pradesh |
11685987 |
6439312 |
| Arunachal Pradesh |
35254 |
37563 |
| Assam |
3761890 |
1400109 |
| Bihar |
11331889 |
2456483 |
| Chhattisgarh |
4070686 |
2378705 |
| Gujarat |
3962497 |
1980671 |
| Haryana |
566820 |
209112 |
| Himachal Pradesh |
1025535 |
587755 |
| Jammu & Kashmir |
366434 |
226215 |
| Jharkhand |
3911890 |
1281218 |
| Karnataka |
5301425 |
1156452 |
| Kerala |
2898047 |
1111667 |
| Madhya Pradesh |
11486699 |
6821646 |
| Maharashtra |
5754987 |
1671597 |
| Manipur |
323196 |
223086 |
| Meghalaya |
384290 |
200652 |
| Mizoram |
184501 |
85839 |
| Nagaland |
333690 |
100560 |
| Odisha |
5381112 |
3000824 |
| Punjab |
805298 |
273444 |
| Rajasthan |
9827121 |
6216837 |
| Sikkim |
74527 |
54694 |
| Tamil Nadu |
7815209 |
3896002 |
| Tripura |
586147 |
545860 |
| Uttar Pradesh |
12759639 |
5334315 |
| Uttarakhand |
957301 |
610808 |
| West Bengal |
10731321 |
8140277 |
| Other States and Union Territories |
118070 |
93626 |
| India |
116441462 |
56535329 |
Note: MGNREGS: Mahatma Gandhi National Rural Employment Guarantee Scheme.
Source: Based on data from the Survey of Employment and Unemployment, National Sample Survey, 66th Round.
It may be argued that this discrepancy is due to the fact that the NSS uses a different concept of household than the one used by the MGNREGS. In the NSSO Surveys, a household is defined as a group of persons normally living together and taking food from a common kitchen. On the other hand, the Operational Guidelines, 2008, of the MGNREGS refer to a household as
a nuclear family comprising mother, father, and their children, and may include any person wholly or substantially dependent on the head of the family. Household will also mean a single-member family.
Given that the MGNREGS provides a guarantee of 100 days of employment per household, there is an incentive for households to sub-divide themselves and to apply for separate job cards for each family.
We, however, believe that the discrepancy between the number of households with job cards and the number of job cards issued is not only because the definition of the household used by the NSSO is not the same as that used by the Ministry of Rural Development, but also because the data presented by the latter come from administrative records that have been manipulated by local-level administrators.
The first indication that the discrepancy between the two sets of data may not be a result merely of different definitions of the household is the scale of the discrepancy itself. The large difference between the NSSO estimates and the numbers reported in the MIS data, particularly in some States, cannot be explained by the high incidence of joint families. To illustrate, according to the National Family Health Survey data for 1992–93, most households in rural India were nuclear families and joint families accounted for only 27.4 per cent of households in rural areas (Niranjan et al., 1998). Given this, even if joint families had multiple job cards, the total number of job cards is unlikely to have been more than double the number of households estimated by the NSS.
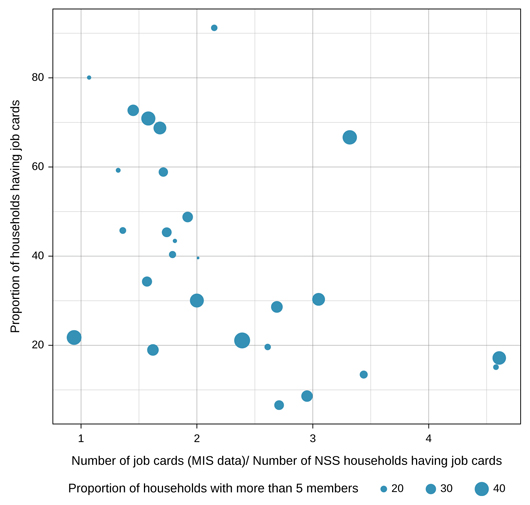
If it were the case that the discrepancy was because the NSS households comprised multiple MGNREGS families, the ratio of job cards (as per the MIS data) to number of registered households (as per the NSS data) would be a measure of the average number of job cards per registered household. In Appendix Figure A1, we have plotted the proportion of households having job cards with the ratio of job cards as per MIS data and the number of NSS households that have job cards. The dot for each State has been sized according to the proportion of job card-holding households that have more than five members. The figure shows that the discrepancy between the MIS data and the NSS data is high in States where the proportion of households with job cards is low. The most noteworthy States in this category are Punjab, Haryana, Maharashtra, Bihar, and Karnataka. The figure clearly shows that the extent of discrepancy between MIS data and NSS data is unrelated to the incidence of large households (as measured using NSS data). The proportion of large households is not necessarily high in States where the discrepancy between the two sets of data is high.3
Our field experience has shown that joint families typically sub-divide households when they are covered under official surveys, in anticipation of benefits from schemes targeted at individual households. As a result, we have often found that official surveys of households, including the Census of India and the NSSO surveys, enumerate a larger number of households and smaller households than in reality. Such a distortion in the NSS data further implies that the discrepancy between MIS data and NSS data is not only because the NSS data enumerate nuclear families as joint households. The large discrepancy between data reported by households and data in the administrative records points to the possibility of fudging and over-reporting in the administrative records. The data seem consistent with the possibility that job cards are issued but not delivered to households, on a very large scale. This needs to be examined.
In Karnataka and Uttar Pradesh, two States characterised by very poor implementation of the MGNREGS, there have been reports of job cards having been issued to unidentifiable households as well as multiple job cards being issued in the names of the same heads of households. In Karnataka 5 lakh bogus job cards were identified in 2010 and 10 lakh bogus job cards in January 2012.4 It has been alleged that fake job cards had been issued in Uttar Pradesh, and that “gram pradhans and secretaries are drawing money through these fake job cards.”5
Demand for Work and Provision of Work under MGNREGS
Under the MGNREGS, a household has the right to demand up to 100 days of employment in a year. The households that demand employment are supposed to be provided work within 15 days of their demand, or be provided unemployment allowance. The NSS data show that this aspect of the guarantee is not being implemented.
Data from the 66th Round of the NSS Survey on Employment and Unemployment show that a substantial proportion of rural households demanded work under MGNREGS, but were not provided any work at all. About two-thirds of such households were not given work because they had not been issued job cards.
Measurement of Demand for Employment under MGNREGS
There are no accurate data on the number of days of employment provided to rural households under the MGNREGS, in response to their demand for work. The NSS Survey asked respondents if they had sought employment under MGNREGS, and this question was put to all households, irrespective of whether they had a job card or not. The proportion of households that sought work but did not get any work gives us a useful, though inadequate, measure of the unmet demand for work under MGNREGS.6
The proportion of rural households that sought work but did not get any is an inadequate measure of the unmet demand for work, for the following reasons. First, it does not capture the extent of under-provisioning of employment to those who were given some employment. That is, it does not capture the gap between the days of employment demanded and the days of employment provided. Further, many households that were not issued job cards may not have formally sought work because they knew they could not get work unless they had job cards. Also, in a situation where public works were not being organised by the local administration, there may have been households that wanted employment under the MGNREGS but did not actively seek work because public works had not been organised. Given all this, estimates based on these NSS data should be treated as a lower bound of the unmet demand for work under the MGNREGS.
At the same time, it must be noted that these data provide a better measure of the demand for work than the official MIS statistics on the number of households and persons who demanded work under the Scheme. MIS data on the number of households/persons who demanded work refer to job card-holding households/persons whose applications were actually recorded. These data are extremely inaccurate and the following points need to be noted in this regard.
First, the MIS data do not reflect households that did not have job cards but may have wanted to work because such persons cannot make an application for being provided employment. Secondly, in practice, the MGNREGS seldom works as a demand-driven scheme. Almost as a rule, job card holders are called to work when public works are organised. The formality of application for work is also done only when such works are organised. As a result, the difference between the MIS data on the number of persons/households who demanded work and the number of persons/households who were provided employment is very small (see Annexure Table A1). Only in exceptional cases do the job card holders, on their own, manage to have their applications registered to work under the MGNREGS. Correspondingly, no unemployment allowances are paid to job card holders who may have applied for work but were not given work. MIS data on the payment of unemployment allowance show that the allowance is not paid even to the extent of the small gap between employment demanded and employment provided (MIS data show zero payments for all States).
Proportion of Households that Demanded Employment but Did Not Get Any
Table 5 gives the proportion of rural labour households that got some employment under the MGNREGS, the proportion of rural labour households that sought but did not get any employment, and the proportion of rural labour households that did not seek employment. Table 6 gives the corresponding figures for all rural households. These tables show that, in India as a whole, a total of 59 per cent of rural labour households and 45 per cent of all rural households sought employment under the MGNREGS. Of these, 22 per cent of rural labour households and 20 per cent of all rural households were not provided any employment. This suggests that there was a large unmet demand for employment under the Scheme.
Table 5 Proportion of rural labour households that got work, sought work but did not get any, and did not seek work under MGNREGS, based on NSS data, 2009–10
| State | Rural labour households having job cards (%) | Rural labour households not having job cards (%) | All rural labour households (%) | ||||||
| Got some work | Sought work but did not get any | Did not seek work | Got some work | Sought work but did not get any | Did not seek work | Got some work | Sought work but did not get any | Did not seek work | |
| Andhra Pradesh | 50 | 4 | 5 | 2 | 10 | 30 | 51 | 14 | 35 |
| Arunachal Pradesh | 34 | 0 | 0 | 0 | 27 | 39 | 34 | 27 | 39 |
| Assam | 29 | 11 | 4 | 1 | 12 | 42 | 30 | 24 | 46 |
| Bihar | 16 | 8 | 5 | 1 | 35 | 35 | 17 | 43 | 40 |
| Chhattisgarh | 53 | 7 | 7 | 1 | 14 | 18 | 54 | 21 | 25 |
| Gujarat | 30 | 7 | 8 | 1 | 12 | 42 | 31 | 19 | 50 |
| Haryana | 12 | 3 | 0 | 0 | 18 | 66 | 12 | 21 | 67 |
| Himachal Pradesh | 53 | 4 | 5 | 0 | 4 | 33 | 53 | 9 | 38 |
| Jammu & Kashmir | 29 | 12 | 6 | 0 | 21 | 31 | 29 | 33 | 38 |
| Jharkhand | 26 | 15 | 3 | 3 | 20 | 32 | 29 | 37 | 35 |
| Karnataka | 13 | 4 | 6 | 0 | 9 | 68 | 14 | 13 | 73 |
| Kerala | 20 | 5 | 7 | 1 | 8 | 59 | 21 | 13 | 67 |
| Madhya Pradesh | 57 | 15 | 15 | 1 | 5 | 6 | 58 | 20 | 21 |
| Maharashtra | 7 | 7 | 5 | 0 | 20 | 62 | 7 | 27 | 66 |
| Manipur | 76 | 0 | 0 | 0 | 9 | 15 | 76 | 9 | 15 |
| Meghalaya | 54 | 2 | 3 | 0 | 13 | 23 | 54 | 20 | 27 |
| Mizoram | 99 | 0 | 1 | 0 | 0 | 0 | 99 | 0 | 1 |
| Nagaland | 73 | 0 | 0 | 15 | 5 | 7 | 88 | 5 | 7 |
| Odisha | 32 | 15 | 8 | 1 | 20 | 25 | 33 | 35 | 32 |
| Punjab | 11 | 3 | 3 | 0 | 27 | 55 | 11 | 31 | 58 |
| Rajasthan | 78 | 6 | 4 | 0 | 2 | 10 | 78 | 8 | 13 |
| Sikkim | 31 | 0 | 1 | 0 | 2 | 66 | 31 | 3 | 66 |
| Tamil Nadu | 44 | 2 | 4 | 1 | 5 | 43 | 45 | 8 | 47 |
| Tripura | 90 | 0 | 0 | 0 | 6 | 3 | 91 | 6 | 4 |
| Uttar Pradesh | 32 | 5 | 2 | 0 | 18 | 42 | 32 | 23 | 44 |
| Uttarakhand | 46 | 10 | 1 | 0 | 8 | 35 | 46 | 17 | 36 |
| West Bengal | 60 | 13 | 2 | 0 | 10 | 14 | 60 | 23 | 17 |
| Union Territories and other States | 21 | 8 | 5 | 0 | 18 | 48 | 21 | 26 | 53 |
| India | 36 | 7 | 5 | 1 | 14 | 36 | 37 | 22 | 41 |
Source: Based on data from the Survey of Employment and Unemployment, National Sample Survey, 66th Round.
Table 6 Proportion of rural households that got work, sought work but did not get any, and did not seek work under MGNREGS, based on NSS data, 2009–10
| State | Rural households having job cards (%) | Rural households not having job cards (%) | All rural households (%) | ||||||
| Got some work | Sought work but did not get any | Did not seek work | Got some work | Sought work but did not get any | Did not seek work | Got some work | Sought work but did not get any | Did not seek work | |
| Andhra Pradesh | 35 | 4 | 5 | 1 | 8 | 48 | 35 | 12 | 53 |
| Arunachal Pradesh | 21 | 3 | 1 | 0 | 25 | 47 | 22 | 30 | 48 |
| Assam | 18 | 9 | 3 | 0 | 14 | 56 | 18 | 23 | 59 |
| Bihar | 9 | 6 | 3 | 1 | 30 | 51 | 10 | 36 | 54 |
| Chhattisgarh | 47 | 5 | 7 | 1 | 16 | 24 | 48 | 21 | 31 |
| Gujarat | 21 | 6 | 9 | 0 | 11 | 53 | 21 | 17 | 62 |
| Haryana | 5 | 1 | 0 | 0 | 13 | 80 | 5 | 14 | 81 |
| Himachal Pradesh | 33 | 5 | 7 | 0 | 4 | 51 | 33 | 8 | 58 |
| Jammu & Kashmir | 9 | 8 | 5 | 1 | 15 | 61 | 10 | 24 | 67 |
| Jharkhand | 18 | 13 | 5 | 2 | 19 | 43 | 19 | 32 | 48 |
| Karnataka | 8 | 3 | 4 | 0 | 12 | 73 | 8 | 15 | 77 |
| Kerala | 11 | 3 | 6 | 0 | 9 | 71 | 11 | 12 | 77 |
| Madhya Pradesh | 40 | 13 | 23 | 1 | 10 | 12 | 41 | 24 | 35 |
| Maharashtra | 4 | 5 | 4 | 0 | 18 | 68 | 4 | 23 | 72 |
| Manipur | 76 | 0 | 0 | 1 | 4 | 19 | 77 | 4 | 19 |
| Meghalaya | 46 | 1 | 6 | 0 | 11 | 32 | 46 | 15 | 39 |
| Mizoram | 91 | 0 | 0 | 0 | 4 | 5 | 91 | 4 | 5 |
| Nagaland | 58 | 8 | 1 | 2 | 8 | 24 | 60 | 16 | 25 |
| Odisha | 22 | 12 | 7 | 0 | 17 | 42 | 22 | 29 | 49 |
| Punjab | 5 | 2 | 2 | 0 | 24 | 67 | 5 | 26 | 69 |
| Rajasthan | 62 | 6 | 7 | 0 | 5 | 20 | 62 | 11 | 27 |
| Sikkim | 44 | 0 | 1 | 0 | 1 | 53 | 44 | 2 | 54 |
| Tamil Nadu | 33 | 2 | 4 | 1 | 6 | 54 | 34 | 8 | 59 |
| Tripura | 78 | 0 | 3 | 0 | 8 | 11 | 78 | 8 | 14 |
| Uttar Pradesh | 16 | 3 | 3 | 0 | 16 | 62 | 16 | 19 | 65 |
| Uttarakhand | 29 | 5 | 3 | 0 | 6 | 57 | 29 | 11 | 59 |
| West Bengal | 43 | 12 | 5 | 0 | 11 | 29 | 43 | 23 | 34 |
| Union Territories and other States | 9 | 5 | 7 | 0 | 8 | 72 | 9 | 12 | 79 |
| India | 24 | 6 | 6 | 0 | 14 | 50 | 25 | 20 | 55 |
Source: Based on data from the Survey of Employment and Unemployment, National Sample Survey, 66th Round.
The tables also show that about two-thirds of the households that sought employment but were not provided any were households that had not been issued job cards. In other words, these data suggest that large-scale exclusion of rural households from the MGNREGS takes place by not providing job cards to a large number of households that are interested in working under the Scheme.
Further, State-level estimates show that there is a large unmet demand for employment under MGNREGS not only in low-income States like Bihar, Jharkhand, Odisha, and Uttar Pradesh, but also in some high-income States. These data fly in the face of the argument that employment under MNREGS in high-income States like Punjab, Haryana, and Maharashtra is low because agricultural wages are high. The proportion of rural labour households that sought work under MNREGS but did not get work was 43 per cent in Bihar, 37 per cent in Jharkhand, and 35 per cent in Odisha. In Punjab, while only 11 per cent of rural labour households got some work under MGNREGS, another 31 per cent sought work but did not get employed. In Maharashtra, 7 per cent of rural labour households got some work under MGNREGS, while another 27 per cent sought work but did not get any. The States in which the proportion of rural labour households that sought employment but did not get any was lower than 10 per cent were Mizoram, Sikkim, Tripura, Rajasthan, Tamil Nadu, Manipur, and Himachal Pradesh.
It may also be noted that, as per the NSS data, of the rural households that had job cards, 66 per cent got some work, and another 16 per cent sought work but did not get any. On the other hand, as per the MIS data, in 2009–10, only 38.8 per cent of job card holders demanded work and 38.7 per cent actually received work. This gives further weight to the possibility that a large number of households that, according to MIS data, have job cards but do not seek work are actually households that have not been issued job cards.
Days of Work
Table 7 gives NSSO and MIS data on the total number of days of employment generated under MGNREGS in 2009–10. The number of days of employment generated under the MGNREGS in the country as a whole, as per the NSS Survey, was about 22 per cent lower than the days of employment claimed to have been generated in the administrative (MIS) records.
Table 7 Total person-days of employment generated through MGNREGS, National Sample Survey and Management Information System of the Ministry of Rural Development, 2009–10
| State | Total person-days of employment | |
| National Sample Survey |
Management Information System of
the Ministry of Rural Development |
|
| Andhra Pradesh | 244123075 |
20359057 |
| Arunachal Pradesh | 1667859 |
283640 |
| Assam | 27186509 |
35723813 |
| Bihar | 33100967 |
46692853 |
| Chhattisgarh | 68140320 |
80929340 |
| Gujarat | 29325521 |
51801505 |
| Haryana | 6276959 |
5812282 |
| Himachal Pradesh | 20534707 |
26379027 |
| Jammu & Kashmir | 3242327 |
2938056 |
| Jharkhand | 15741005 |
73406584 |
| Karnataka | 18253570 |
200440069 |
| Kerala | 16642182 |
34035275 |
| Madhya Pradesh | 105827270 |
132926671 |
| Maharashtra | 18550619 |
19166206 |
| Manipur | 12848467 |
1667399 |
| Meghalaya | 8619572 |
5188596 |
| Mizoram | 6367059 |
8096740 |
| Nagaland | 3544507 |
8593718 |
| Odisha | 43232739 |
51640215 |
| Punjab | 5003559 |
6288410 |
| Rajasthan | 367106335 |
354322689 |
| Sikkim | 3106429 |
1565373 |
| Tamil Nadu | 140962504 |
222654993 |
| Tripura | 32178455 |
46023990 |
| Uttar Pradesh | 128581536 |
249033041 |
| Uttarakhand | 11091901 |
8891048 |
| West Bengal | 99121137 |
109652972 |
| India | 1471143302 |
1804775188 |
Note: MGNREGS: Mahatma Gandhi National Rural Employment Guarantee Scheme.
Source: Based on data from the Survey of Employment and Unemployment, National Sample Survey, 66th Round, and on data from the Management Information System of the MGNREGS.
The State-level data show two different types of tendencies. For some States, most notably Andhra Pradesh, MIS data are incomplete or are completed only after a significant delay. In such States, the MIS data on the extent of employment generated under the Scheme are lower than the NSS estimates. On the other hand, in most States, the MIS data significantly over-report the employment generated under MGNREGS. The most noteworthy case is Karnataka, where the MIS data on total employment is about 11 times the employment reported by households in the NSS Survey. For Jharkhand, the days of employment as per the MIS data are about 4.7 times the days of employment reported in the NSS Survey.
The fact that in many States the NSS Survey, which is a representative survey at the State-level, shows that households have received considerably lower number of days of employment than what is reported in the official statistics, is a further indication of possible manipulation of MIS statistics to over-report levels of employment generated through MGNREGS.
According to the NSS data, in 2009–10, on average, a household with a job card got employment for only 37 days under MGNREGS (Table 8). The NSS data also show a positive relationship between the proportion of households that got work and the number of days of work per household (Figure 1). This indicates that the provision of employment under MGNREGS is higher in States that have better coverage in terms of registration of households. Dividing them into four zones by the national average, we can classify the States according to performance of the Scheme. The North-Eastern States, Rajasthan, Himachal Pradesh, Andhra Pradesh, and Tamil Nadu stand out in performance in terms of registration of households and provision of employment. In Chhattisgarh, Madhya Pradesh, Uttarakhand, and West Bengal, the proportion of households registered was higher than the all-India average but provision of employment was below the average. Particularly in West Bengal, the MGNREGS is very thinly spread. The remaining States are poor in performance in terms of both registration of households and provision of employment.
Table 8 Average person-days of employment per household generated through MGNREGS, National Sample Survey and Management Information System of the Ministry of Rural Development, 2009–10
| State | Person-days of employment per household | |
| National Sample Survey |
Management Information System of
the Ministry of Rural Development |
|
| Andhra Pradesh | 47 | 13 |
| Arunachal Pradesh | 54 | 16 |
| Assam | 32 | 25 |
| Bihar | 24 | 32 |
| Chhattisgarh | 35 | 37 |
| Gujarat | 25 | 35 |
| Haryana | 39 | 37 |
| Himachal Pradesh | 47 | 53 |
| Jammu & Kashmir | 33 | 36 |
| Jharkhand | 23 | 45 |
| Karnataka | 30 | 57 |
| Kerala | 26 | 36 |
| Madhya Pradesh | 29 | 38 |
| Maharashtra | 33 | 42 |
| Manipur | 57 | 40 |
| Meghalaya | 50 | 32 |
| Mizoram | 76 | 59 |
| Nagaland | 40 | 33 |
| Odisha | 26 | 40 |
| Punjab | 30 | 25 |
| Rajasthan | 70 | 58 |
| Sikkim | 59 | 45 |
| Tamil Nadu | 43 | 43 |
| Tripura | 61 | 80 |
| Uttar Pradesh | 31 | 37 |
| Uttarakhand | 23 | 30 |
| West Bengal | 17 | 22 |
| India | 37 | 40 |
Note: MGNREGS: Mahatma Gandhi National Rural Employment Guarantee Scheme.
Source: Based on data from the Survey of Employment and Unemployment, National Sample Survey, 66th Round, and on data from the Management Information System of the MGNREGS.
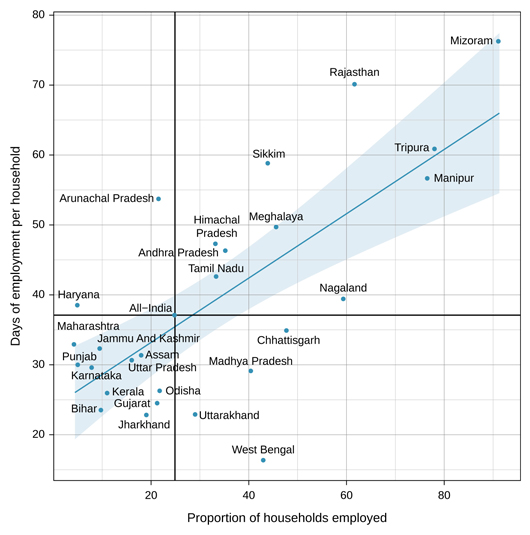
Figure 1 Proportion of households employed and days of employment per household, by State, 2009–10
Source: Based on data from the Survey of Employment and Unemployment, National Sample Survey, 66th Round.
Since NSS data on the MNREGS are available only for one year, we cannot use these to analyse trends in employment generation over time. Table 9 gives the MIS data on total person-days of employment generated under the MGNREGS across different States. It is interesting to note that even the MIS data, which generally over-report levels of employment generated, show that the total person-days of employment generated under MGNREGS declined by about 5 per cent between 2010–11 and 2011–12. This decline in employment generation was driven by a very sharp fall in MGNREGS work in some States: total person-days of employment fell by about 53 per cent in Odisha, 37 per cent in Bihar, 36 per cent in Karnataka, 32 per cent in Gujarat, 24 per cent in Jharkhand, 19 per cent in Assam, 18 per cent in Rajasthan, and 17 per cent in Punjab.
Table 9 Person-days of employment generated under MGNREGS, 2008–09 to 2011–12 1000 person-days
| State | 2008–09 | 2009–10 | 2010–11 | 2011–12 |
| Andhra Pradesh | NA | 20359 |
301455 |
288824 |
| Arunachal Pradesh | 40 |
284 |
NA | 61 |
| Assam | 21222 |
35724 |
43377 |
35258 |
| Bihar | 17232 |
46693 |
105640 |
67013 |
| Chhattisgarh | 66505 |
80929 |
109464 |
120675 |
| Goa | 2 |
198 |
359 |
311 |
| Gujarat | 8421 |
51802 |
46176 |
31300 |
| Haryana | 4701 |
5812 |
8435 |
10941 |
| Himachal Pradesh | 17206 |
26379 |
20995 |
26890 |
| Jammu & Kashmir | 1310 |
2938 |
4917 |
20834 |
| Jharkhand | 55074 |
73407 |
80707 |
60954 |
| Karnataka | 27454 |
200440 |
109823 |
70103 |
| Kerala | 15624 |
34035 |
49323 |
63310 |
| Madhya Pradesh | 146289 |
132927 |
178254 |
167589 |
| Maharashtra | 34214 |
19166 |
18890 |
74285 |
| Manipur | 3465 |
1667 |
1699 |
22407 |
| Meghalaya | 3322 |
5189 |
16482 |
16767 |
| Mizoram | 6187 |
8097 |
11281 |
13056 |
| Nagaland | 11300 |
8594 |
30445 |
27190 |
| Odisha | 43259 |
51640 |
97571 |
45375 |
| Punjab | 509 |
6288 |
7782 |
6452 |
| Rajasthan | 388530 |
354323 |
259519 |
212055 |
| Sikkim | 226 |
1565 |
3001 |
3288 |
| Tamil Nadu | 8548 |
222655 |
263633 |
301575 |
| Tripura | 28339 |
46024 |
37444 |
48974 |
| Uttar Pradesh | 116076 |
249033 |
311435 |
267332 |
| Uttarakhand | 2589 |
8891 |
20314 |
19898 |
| West Bengal | 35899 |
109653 |
143511 |
149243 |
| Union Territories | 11 |
64 |
1375 |
2071 |
| Total | 1063557 |
1804775 |
2283305 |
2174029 |
Source: Based on data from the Management Information System of the MGNREGS.
This decline in person-days of employment was driven by a reduction in the number of households (and number of persons) who were provided work (and not by a decline in average days of work per household/person). In other words, in 2011–12, there was a considerable decline in the number of households and number of workers that were provided employment under the MGNREGS in a number of States.
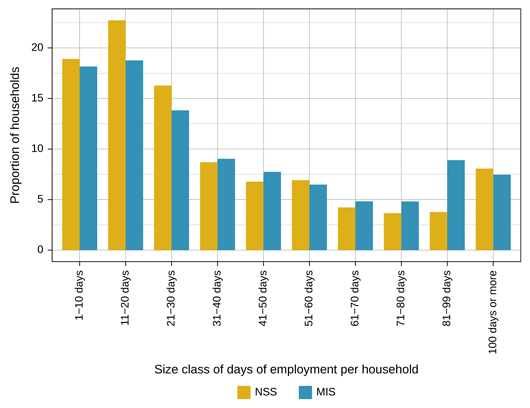
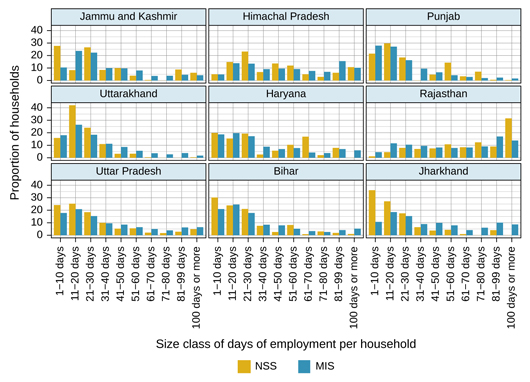
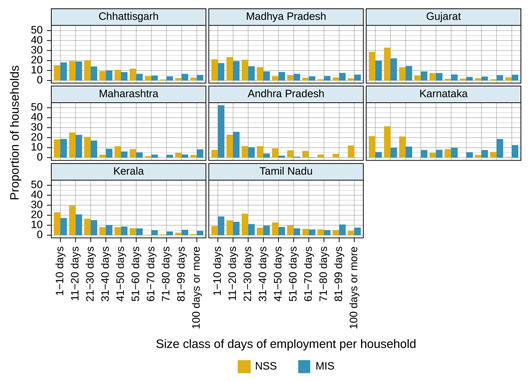
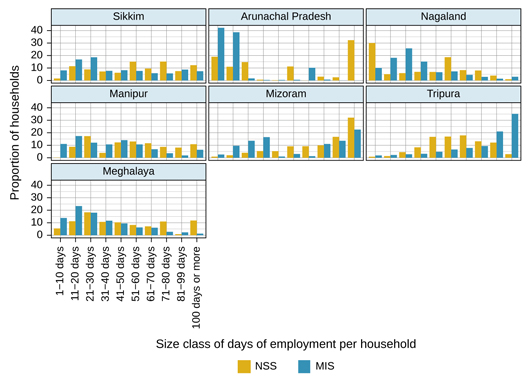
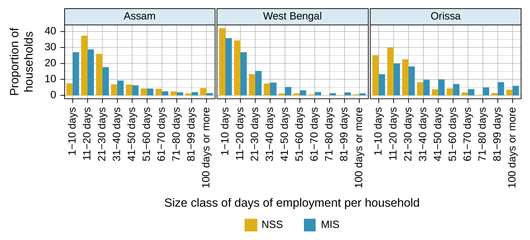
Earlier in this note, we discussed the possible reasons for the differences between NSS and MIS data on the number of households registered under MGNREGS. Data on days of employment provide strong evidence that the differences in the estimates are not on account of partitioning of households in issuing MGNREGS job cards. If a significant number of household units in the NSS Survey had more than one job card (that is, if segments of such households were identified as separate households under MGNREGS), one would expect it to affect the distribution of households according to days of employment per household. It could then be expected that such a distribution, based on NSS data, would have a heavier right tail than the distribution based on MIS data. Annexure Table A2 shows, using NSS data, the distribution of households that had job cards and that reported having worked under MGNREGS, by size-classes of days of employment under MGNREGS. Table A3 shows a comparable distribution created using MIS data. Figures A2.1 to A2.5 show a comparison of these distributions. The distributions show that, for most States and for India as a whole, the case is exactly the opposite: the MIS data have a higher proportion of households at the upper end of the distribution than the NSS data.
The distributions presented in these Annexure tables and figures lend support to the argument that the discrepancy between NSS data and MIS data in the number of households registered under MGNREGS is a result not of different definitions of households, but of an inflation of the number of job cards issued in the MGNREGS records. Further, the distributions show that for a significant proportion of households, days of actual employment provided under MGNREGS are lower than what was recorded as provided. Given this, the natural next question to ask is how, and by whom, the excess wages are siphoned out. That, of course, is not a question to which we can expect to get an answer from the NSS data.
Conclusions
This paper analyses some aspects of the performance of the Mahatma Gandhi National Rural Employment Guarantee Scheme (MGNREGS). Detailed data on the employment provided to households under MGNREGS were collected in the 66th Round of the NSS Survey of Employment and Unemployment for 2009–10. These data show that about 35 per cent of rural households and 48 per cent of rural labour households were registered and issued job cards under the Scheme. In Mizoram, almost all rural labour households and in Tripura, over 90 per cent of rural labour households had MGNREGS job cards. In Rajasthan, Madhya Pradesh, and West Bengal, over 75 per cent of rural labour households had job cards. In contrast, in Haryana, Punjab, Maharashtra, Karnataka, Bihar, and Arunachal Pradesh, less than 30 per cent of rural labour households had been provided job cards.
The NSS data show that there was a large unmet demand for employment under MGNREGS in 2009–10. The data show that 37 per cent rural labour households got employment under the Scheme. In addition, 22 per cent of rural labour households sought work but were not provided employment. Of these households, 14 per cent did not have job cards. State-level data show that the extent of unmet demand for employment under MGNREGS was high not only in low-income States like Bihar, Jharkhand, Odisha, and Uttar Pradesh, but also in high-income States like Punjab, Haryana, and Maharashtra where implementation of the MGNREGS was very poor.
Data on days of employment from the NSS Survey show that, on average, a household with a job card received employment for about 37 days under MGNREGS. There was a large variation across States in respect of days of employment per job card-holding household. The average number of days of employment under the Scheme was 76 days in Mizoram, 70 days in Rajasthan, and 61 days in Tripura.
A comparison of the NSS data on employment under MGNREGS and the administrative statistics from the Management Information System of the MGNREGS brings to light serious problems in the implementation of the Scheme. First, there is a huge gap between the number of households that have job cards and the number of job cards that are officially recorded to have been issued. A detailed examination of the data suggests a strong possibility that a number of cards are officially issued but not provided to the households. Secondly, the gap between the proportion of households that sought work and those who got work under MGNREGS is much higher in the NSS data than in the MIS data. According to the MIS data, a large proportion of job card-holding households never sought work or worked under the Scheme. This lends further support to the possibility that a large number of households never received the job cards that were issued. Finally, the MIS data are found to systematically over-record the level of employment provided to households. The total number of days of employment recorded by the MIS is about 22 per cent higher than the days of employment reported by households in the NSS Survey. This disparity is highest in Karnataka, where MIS records show 11 times more employment than that reported in the NSS Survey, and in Jharkhand, where MIS records show 4.7 times more employment than that reported in the NSS Survey. The distribution of households by days of employment suggests that for a significant number of households, more work is recorded than what these households do. The question then is, how, and by whom, the wages corresponding to this excess employment are siphoned out.
Keywords: The Mahatma Gandhi National Rural Employment Guarantee Scheme (MGNREGS), NREGA, job cards, rural labour households, employment.
Acknowledgements: The authors would like to thank V. K. Ramachandran and Takashi Kurosaki for their comments on this paper. A part of this work was done when Vikas Rawal was visiting the Institute of Economic Research, Hitotsubashi University, Japan.