

Food Subsidies in India
Revisiting the Estimates
*Senior Research Fellow, International Food Policy Research Institute (IFPRI), New Delhi, S.Narayanan@cgiar.org
†World Bank, Washington, D. C.
Abstract: There is a view that the fiscal burden of food subsidies in India is unsustainable. Yet popular debate and discussion around the costs of these food subsidies, relative to their benefits, are misleading for two reasons. First, they typically treat reported budgetary subsidy estimates—i.e. the fiscal cost to the government of the distribution of food via ration shops—as equivalent to “transfers” to beneficiaries. Secondly, they tend to focus exclusively on consumers. In doing so, they neglect the two-part nature of the food distribution system, which includes payments to farmers at the time of procurement. This paper examines ways of measuring the costs and value of the food subsidy. We present estimates that combine the implicit value of benefits to consumers arising from the reduced price of grain sold to consumers via ration shops, with implicit benefits to farmers, in terms of the price difference between what farmers are paid by the government and what they would have obtained in the open market. This approach shows that each rupee of the “food subsidy” reported in government accounts represents a transfer worth Rs 1.29 to consumers and farmers, on average, over the period 2001–02 to 2022–23. That is, each rupee transferred to these groups is associated with a cost of Rs 0.79 to the government.
Keywords: India food subsidy, public distribution system (PDS), minimum support price (MSP), economic subsidy, fiscal burden measurement, implicit transfers, food grain procurement, cost-benefit analysis India, in-kind vs cash transfers
Introduction
A rising food subsidy bill has become the basis for an oft-repeated view that the fiscal burden of these food subsidies is unsustainable (Nandakumar 2020). In 2023–24, food subsidies accounted for about 13 per cent of the fiscal deficit and about 5 per cent of the total government budget, amounting to Rs 220 billion.
Apart from the sheer scale of funding for food procurement and distribution and its potential spillover effects on prices, many critics argue the costs of India’s food assistance programmes outstrip their benefits (see Balakrishnan and Ramaswami 2002; Gulati, Gujral, and Nandakumar 2012; Mishra 2013; Panagariya and Bhagawati 2014).1 Estimates of the cost of transferring a rupee worth of benefits to consumers in terms of food grain range from Rs 1.43 to Rs 9 across various studies, reviewed in detail later. There is thus considerable support for the view that food subsidies in India are not only large but also cost-inefficient. These have, in turn, led to suggestions that the current architecture of food aid within the country needs to be dismantled in favour of something that is more cost-efficient, such as cash transfers (Kapur, Mukhopadhyay, and Subramanian 2008; Kotwal, Murugkar, and Ramaswami 2011; Gulati et al. 2012; Rahman and Pingali 2024).
Yet such arguments neglect some key issues. First, many popular commentaries typically treat reported budgetary estimates of food subsidies as equivalent to “transfers” to beneficiaries. Secondly, they tend to focus exclusively on food distribution, i.e. in-kind distribution of food via ration shops to consumers. At the heart of the current food subsidy regime in India is a coupled system that integrates procurement and distribution. As part of the procurement system, food grain, notably rice and wheat, is procured from farmers at a pre-announced price, the Minimum Support Price (MSP); at the other end, a vast in-kind distribution system via the Public Distribution System (PDS) entails sale of food grain to end consumers at discounted prices. Our contention is that, as others have argued, the latter cannot be viewed in isolation from the former and that we need a better understanding of the economics of food subsidies that goes beyond a consumer-centric view (Swaminathan 1999, 2000a, 2000b; Basu 2011; Desai, D’Souza, and Namboodri 2014; Sharma and Alagh 2013; Deaton 2015; Drèze 2019).
This paper revisits the debate on food subsidies in India with the aim of clarifying issues around the appropriate way to measure the “costs” and “benefits” when one views the food subsidy regime as comprising both compensation to producers (via procurement) and to consumers (via discounted sales of foodgrain).2 We then propose an approach to answer two key questions: What does a rupee worth of transfer to consumers really cost when compensation to farmers is also factored in? How does this cost change under different scenarios that seek to improve the efficiency of the food distribution system?
This paper does not offer prescriptions around policy options but furthers our understanding of food subsidies in India by providing a conceptual framework for thinking about this issue and providing estimates based on such a framework that can serve as the basis for policy formulation.
The paper is organised as follows. Section 2 provides a simplified background of the foodgrain (rice/wheat) procurement and distribution system in India. We then turn our attention to the notion of budgetary food subsidy, which is essentially the cost to the government of maintaining the food procurement and distribution system. In Section 3, we describe an alternate conception of subsidy – the economic subsidy (or implicit subsidy/transfer) that attempts to measure the value of transfers for both consumer and farmer. We then turn our attention to our key proposal to estimate the total value of subsidies to farmers and consumers in the context of a coupled system – where farmers receive payments for supplying foodgrain and consumers benefit from discounted prices relative to what they might have had to obtain in the market (Section 4). We highlight how these different conceptions differ from one another and provide estimates of the costs of these transfers. We provide a conclusion in Section 5.
Procurement and In-kind Food Distribution in India: A Brief Overview
The architecture of food security in India is built around two main activities – procurement of foodgrain from farmers and their distribution to consumers (Figure 2). The fiscal allocations for these programmes come mainly from the Central Government, although States also allocate funds to these programmes. Despite changes over time, the core approach of the current food subsidy regime has not altered significantly since the mid-1960s.
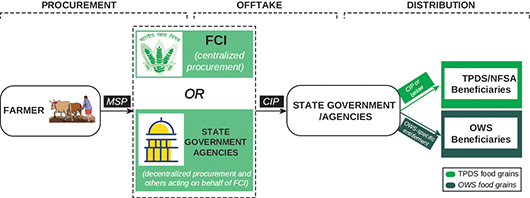
Figure 1 A stylisation of India’s coupled food procurement and distribution system
Notes: Minimum Support Price (MSP) is the price at which food grain is procured; CIP is the Central Issue Price; FCI refers to the Food Corporation of India; OWS means Other Welfare Schemes.
Since the National Food Security Act (NFSA) was passed, the Targeted Public Distribution Scheme (TPDS) category is not relevant anymore and is referred to as NFSA beneficiaries.
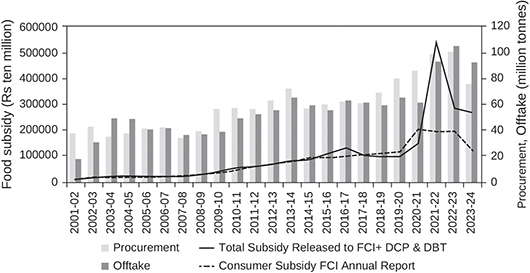
Figure 2 Food subsidy, 2001–02 to 2022–23, India in million nominal rupees and million tonnes
Notes: The steep increase in 2019–20 to 2020–21 reflects a reporting issue, that indicates repayment of loans from the National Small Savings Fund (NSSF). The total subsidy includes transfers to FCI for their operations and Decentralised Procurement and Direct Benefit Transfers.
Source: Procurement and offtake are from the Database on the Indian Economy, Reserve Bank of India; subsidy released is from the FCI Annual Reports (various years) and Food Grain Bulletin Archive (various years in current prices). The details of what is included or excluded are available with the authors.
The Public Distribution System (PDS) refers to a network of fair price or ration shops that offer consumers rice, wheat (and in some States, nutri-cereals, pulses, sugar, oil, and kerosene) at subsidised rates (henceforth, the PDS price). In most States, until recently, the price that was charged and the quantity a household was entitled to depended on whether the household was classified as being below or above the poverty line. Both the PDS price and quantities typically vary by States. In some States, the PDS entitlement is universal or near universal.
In addition to the PDS, foodgrain is also distributed under seven Other Welfare Schemes (OWS), but the PDS is the largest of these schemes and the focus of this paper. In 2013, the Parliament enacted the National Food Security Act (NFSA) that laid out entitlements under the PDS and several OWS (Government of India [GoI] 2013). Up to 75 per cent of the rural population and 50 per cent of the urban population were declared eligible for subsidised foodgrain under the PDS, reaching an estimated 165 million households; these grains would be made available at subsidised prices of Rs 3/2/1 per kg for rice, wheat, and nutri-cereals respectively for a period of three years from the date of commencement of the Act. While the NFSA no longer distinguishes the above and below poverty line households as distinct categories with varying entitlements, it recognises the poorest of the poor, the Antyodaya Anna Yojana (AAY) households as distinct and eligible for up to 35 kg per household per month, whereas priority households are entitled to 5 kg per person per month. These entitlements have been in place since 2013. In April 2020, the government launched the Pradhan Mantri Garib Kalyan Yojana (PMGKAY) in the midst of the first COVID-19 wave to provide an additional 5 kg of free foodgrain to each beneficiary under the NFSA in addition to 5 kg of grain at a highly subsidised rate of Rs 3/2 per kg of rice and wheat. In 2023, the PMGKAY was terminated, with the announcement that under the NFSA, beneficiaries would now be eligible for free grain for a period of five more years (Sinha 2015; Drèze and Khera 2017; Khera 2024).
Virtually all the foodgrain distributed by the Government (especially rice and wheat) is procured under what might well be the largest known procurement scheme in the world. Typically, the Government announces an administrative price (or the MSP) early in the planting season for around 23 commodities – this price is meant to act as a floor so that if the price falls below this, the Government is committed to procuring all that the farmer is willing to sell at the MSP. This price was therefore expected to ensure that the price stays at least as high as the MSP by offering a credible reservation price for the farmer. In theory, this price is operational across India and for all 23 commodities. In practice, however, it is operational only for a few States and a few commodities, notably for rice and wheat.3 Typically, the Centre procures via the Food Corporation of India (FCI), then stocks or distributes this grain to the States at the Central Issue Price (CIP). Several States also procure grain under the Decentralized Procurement Scheme (DCP), which was established in 1997–98 to diversify the geography of procurement (Gupta, Khera, and Narayanan 2021). These costs are reimbursed by the Centre to the States. Further, States often announce bonuses over and above the MSP, and these come from the respective State budgets. Those stocks procured under the DCP are used within States after which the excess is made available to the central pool or for other States. This practice was curtailed by the Centre in 2014 when it became apparent that States often ended up procuring stocks so large that holding these became a challenge for the Centre. Therefore, while the DCP continues, the Centre does not take responsibility for the stocks that States may procure in excess of what is required for distribution under various food-based schemes.
Despite the contribution of the PDS in addressing food security needs of a vast section of vulnerable households (see Narayanan and Gerber (2017) for a review), the cost of this nationwide programme has come under scrutiny for some years now.
In the following sections, we unpack the concept of food subsidy, first focusing on budgetary food subsidy as reported by the Government and then on the notion of “economic” subsidy (or implicit transfers).
Budgetary Food Subsidy: Concept and Measurement
One approach to measuring food subsidy is to calculate the difference between the amount the Central Government spends on acquisition, storage, and distribution of the grain and the amount it recovers from State governments by way of sale price (CIP). To the extent that the costs are larger than the recovery, the difference remains in the books of the Food Corporation of India (FCI) and enters the accounts of the Government of India (GoI) as a subsidy, since it compensates the FCI for this deficit (Figure 2).
This is the dominant understanding of what constitutes food subsidy in India, i.e., the fiscal burden borne by the GoI. In the Economic Survey and the FCI Annual Reports, for example, it is reported as “Consumer Food Subsidy,” implying that this is the net expenditure that the Government incurs on enabling in-kind distribution of foodgrain at subsidised prices.4 This figure has increased steadily on account of the rising costs of acquiring and distributing the grain (Figure 3). At the same time, the low and relatively flat CIP is often viewed as the main culprit since the Central Government’s recovery of costs has not matched the increase in costs in recent years. The Economic Survey, 2020–21 (GoI 2021) noted, for example,
(w)hile it is difficult to reduce the economic cost of food management in view of rising commitment towards food security, there is a need to consider the revision of CIP to reduce the bulging food subsidy bill.
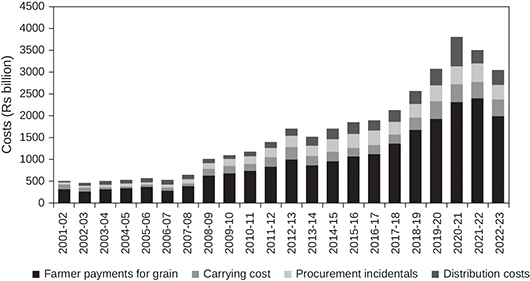
Figure 3 Cost components in procurement of rice and wheat as share of costs, 2001–02 to 2022–23, India in billion nominal rupees
Source: Compiled from the FCI Annual Reports (various years).
It is not uncommon to see these numbers cited in the popular media or government reports and is often interpreted as the value of transfers to consumers, as implied by the term “Consumer Food Subsidy” even though this is an accounting concept.
The budgetary food subsidy (BFS), however, contains four cost components. The first component is called the pooled costs (applied to the quantity procured) and refers to payments to farmers for grain purchases. The second component includes procurement incidentals, which include any state taxes, commissions, bagging materials, labour and transportation, and so on and are also applied to the quantity procured. The first and second components together are referred to as the acquisition costs. The third and fourth components are the carrying or storage costs (applied to the quantity stored), and the distribution costs (applied to the offtake quantities).
The BFS can therefore be defined as:
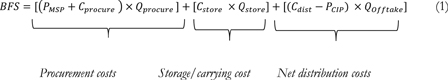
Figure 3 illustrates the share of the different components in the total costs. It is not hard to see that a bulk of the BFS constitutes compensation to farmers, so that embedded in the official figures of Consumer Food Subsidy is a large component that constitutes costs, but of the type that are directed to a specific group of stakeholders, the farmers. Between 2001–02 and 2022–23, as much as 62 per cent of the costs, on average, were compensation to farmers for grain supplied, 25 per cent represented procurement incidentals and distribution costs, and 13 per cent were carrying costs associated with stockholding.
Therefore, before estimating the cost-effectiveness of a rupee’s worth of transfer, we need to contend with the issue of how to treat compensation to farmers (i.e. the pooled costs), an issue we return to later. In question here is whether the farmers are compensated on terms equivalent to market rates or whether they are taxed to be able to subsidise the consumers. To do this, we turn to the idea of what we call the “economic subsidy.”
“Economic” Food Subsidy
So far, we have discussed the components of budgetary food subsidy (BFS) as reported by the Government, noting that it is primarily an accounting concept. An alternate view of subsidy focuses on the benefits to stakeholders. Rather than ask what the state spends in excess of what it recovers, this alternate approach defines subsidy from the point of view of consumers and producers. In this case, subsidies are defined in terms of opportunity cost of participating in the food subsidy system (be it procurement or consumption). This approach is widely adopted by international organisations in the context of trade analysis (see United States Department of Agriculture [USDA] (1994); Gulati and Narayanan (2003); Narayanan (2014); Organisation for Economic Co-operation and Development-Indian Council for Research on International Economic Relations [OECD-ICRIER] (2018); and Sharma (2016) for examples, critiques, and variations of this approach).6
This “economic” subsidy approach is based on an abstract or theoretical counterfactual alternative price at which consumers would have bought grain or farmers would have sold them if public distribution and procurement did not exist. Not all farmers or consumers would have these alternatives in reality, at least not the same alternatives for sure. Thus, consumers eligible to buy grains from the PDS have a choice, in theory: they can decide to buy from the PDS at the subsidised price or buy from the market at the market price. Their economic subsidy can then be calculated as the difference between what they would pay to purchase rice or wheat in the market minus the price they would pay when procuring grains from the PDS instead, multiplied by the quantity of grains they purchase from the PDS. The economic subsidy for consumers has often been referred to in the literature as “implicit transfers” (Drèze and Khera 2013; Himanshu and Sen 2013a, 2013b).
In principle, the market price that consumers face would differ depending on whether the commodity was domestically produced or imported. Since India is a net exporter of rice and wheat, this study only considers domestically produced grain (i.e., the assumption is that rice and wheat are “exportables”). This implies that the study only uses the domestic retail price for the market price and does not consider import prices. The economic subsidy for consumers is calculated for wheat and rice separately and can be represented as follows:
where represents the domestic retail price, represents the price at which consumers can buy rice or wheat from the PDS, and stands for the offtake of rice or wheat from the PDS, i.e. the amount that was released from the public stocks for the PDS. Note that if one were to factor in leakages, the economic subsidy for consumers would be lower to that extent since we would multiply the per unit subsidy by .
Most of the literature on cost-benefit alluded to in the Introduction uses this as a metric of consumer benefits, comparing these to the costs incurred. An early study for the 1980s deemed that Rs 4.27 was incurred by the Central Government to transfer one rupee of income to the poor in Andhra Pradesh, accounting for targeting; and this increased to Rs 6.35 when costs to the State government were considered (Radhakrishna et al. 1987; Dev 1998). At the all-India level, they estimated that the cost of Central Government expenditure to transfer Rs 1 to all consumers was Rs 1.43. (Radhakrishna et al. 1987). Svedberg (2012) noted that for each rupee transferred to poor households through the Targeted Public Distribution System (TPDS), the GoI had a budget expenditure of Rs 9 in 2004–05 and emphasised that it is considerably higher than Rs 3.65 (in 2003–04), that the Planning Commission (2005) had estimated. Chakrabarti and Rajkhowa (2015) noted in the context of the NFSA 2013 that if the Act can deliver on its promise to ensure negligible leakages, the cost of transferring grains of value Rs 1 can fall from Rs 1.5 to Rs 1.2. If leakages continue, the cost could go up to Rs 1.7. Jha, Kotwal, and Ramaswami (2013) and Radhakrishna et al. (1997) underlined that leakages significantly influence the cost-effectiveness of food subsidies.
Just as we have defined the economic subsidy or implicit transfer for consumers, we do the same for farmers. Note that for farmers, the BFS would suggest that the farmers receive compensation for the grain procured, equivalent to () and this indicates a significant amount of “transfer” or redistribution in favour of farmers. The idea of economic subsidy for farmers is different. In theory, farmers can choose whether to sell their produce to the procurement system at the MSP or to sell in the market.7 For farmers compensated for the supply of grains, the economic subsidy, if there is one, would be the price premium they receive as MSP on account of selling their produce to public stocks over the price of sale to the open market, multiplied by the amount sold to the PDS system. In reality, the procurement of produce at the MSP is not available to all farmers and only an estimated 6 per cent of farmers sell to the government and procurement occurs only in some States (see Chand (2003) and Gupta, Khera, and Narayanan (2021) for more on these issues). In some instances, the underlying assumption for computing support is that selling at MSP is an option for all. The World Trade Organization (WTO) for example notes that to measure support to farmers, the MSP must be applied to all “eligible” production (see Narayanan (2014)).
Farmers selling their produce in the open market, rather than to the government at MSP, could sell in the domestic market, where they would receive either the farm gate or mandi price for their produce, or they could export the commodity and receive the export price. In India, few farmers participate directly in the export market, where the benefits are accrued by a long chain of traders and middlemen. To reflect this reality, only domestic prices are considered to calculate the economic subsidy for farmers. We compute the economic subsidy for producers for wheat and rice separately.
Ideally, one would expect the Government to procure only the quantity that is required for distribution, apart from ensuring that buffer stocks are maintained. If that were the case, the procurement quantity would be the same as offtake. However, in the case of India, in 14 out of the 22 years covered in our study, i.e. 2001–02 to 2022–23, procurement outstripped offtake, with the reverse being the case in the remaining eight years. We discuss the implications of procuring only the quantity required for distribution (assuming that buffer stocks do not need replenishment) in which case, the economic subsidy would be multiplied by and not . We also note here that the FCI reports the “pooled cost” per unit of wheat and rice procured separately. The pooled cost represents the compensation to farmers but differs slightly in that it is the weighted average MSP actually paid to farmers across States. The pooled costs is a more accurate estimate of how much the farmers are compensated for the grain. We use this rather than , excluding procurement incidentals as before. Thus, the estimate of economic subsidy to farmers would differ if we were to use this instead – the unit subsidy would be .
The data for this analysis has been taken from publicly available sources (Table 1). An important caveat is that these computations are at a highly aggregated level and mask the substantial diversity in the sub-national experience. For example, prices tend to vary widely across location, time, and grain quality. Averaging entails non-trivial assumptions; the choice of reference markets/prices, quality of grain also matter. We conducted this exercise using three different ways of defining domestic prices (available with the authors). We present one of these approaches in this paper, noting however that the broad results do not change significantly across these methods. We also present all results in nominal terms or at current prices; this is not a problem per se, since the goal of this study is to compare the budgetary and economic food subsidies. Figure 4 shows the economic subsidy for consumers for wheat (left panel) and rice (right panel), as well as the evolution of domestic retail prices and PDS prices in nominal terms. The retail prices of wheat and rice have increased steadily over the last 15 years, reflecting inflation over time, while the average PDS price of wheat remained relatively stable and the average PDS price of rice decreased slightly. Since the retail prices were above the PDS prices for the entire period for both commodities, the economic subsidy for consumers was positive, with the increasing gap reflecting the protection the PDS has offered against inflation. The announcement that households would be able to receive 5 kg of foodgrain per capita for free under the NFSA implies that the PDS price is now driven to 0, so the economic subsidy to consumers for rice and wheat would be even higher.
Table 1 Data description and sources
| Variable name | Definition | Source | Remarks |
| Retail price | Food and Agriculture Organisation Global Information and Early Warning System on Food and Agriculture (FAO-GIEWS) | For both rice and wheat, this is the simple national average of retail prices. Monthly data has been averaged to annual data. See https://fpma.fao.org/giews/fpmat4/#/dashboard/home. | |
| Price prevailing in the mandi where wholesale trade of food grain takes place | Organisation for Economic Co-operation and Development-Producer Support Estimate (OECD-PSE) Cookbook | Mandi. Average monthly state-level prices in markets for the harvest period (April–June for wheat) in Punjab, Uttar Pradesh, Haryana, weighted by state share in the combined production of wheat. Price of rice is converted from price of paddy (using 0.67 conversion rate). This is for non-basmati rice from the four selected States (Uttar Pradesh, Punjab, Andhra Pradesh, West Bengal) during harvest season. As an alternative, we also use reference price representing weighted mandi prices for all mandis in India, for the full year and of state-level weighted farm harvest prices across India. Due to data gaps, these are not presented but are available with the authors. | |
| PDS price | Food Grain Bulletin, Department of Food and Public District, Ministry of Consumer Affairs, Food and Public Distribution. | PDS prices varied by State and by below and above poverty line categories until the NFSA (2013). The PDS price is a weighted average at the state level of the different income categories and averaged across States based on the numbers by number of beneficiaries. After NFSA, the numbers are uniform. | |
| Minimum support price | Database on Indian Economy, Reserve Bank of India | For paddy, the MSP is converted to rice-equivalent. For wheat, the MSP is for the marketing year. It excludes State-level bonuses. Both are for Fair Average Quality (FAQ). | |
| Offtake quantity | Database on Indian Economy, Reserve Bank of India | This is the total quantity of food grains that are distributed via the PDS. See https://dbie.rbi.org.in/DBIE/dbie.rbi?site=statistics (updated) Table 28. | |
| Procurement quantity | Database on Indian Economy, Reserve Bank of India | This is the total quantity of food grains that are procured by all State agencies, including under the DCP. See https://dbie.rbi.org.in/DBIE/dbie.rbi?site=statistics (updated) Table 28. |
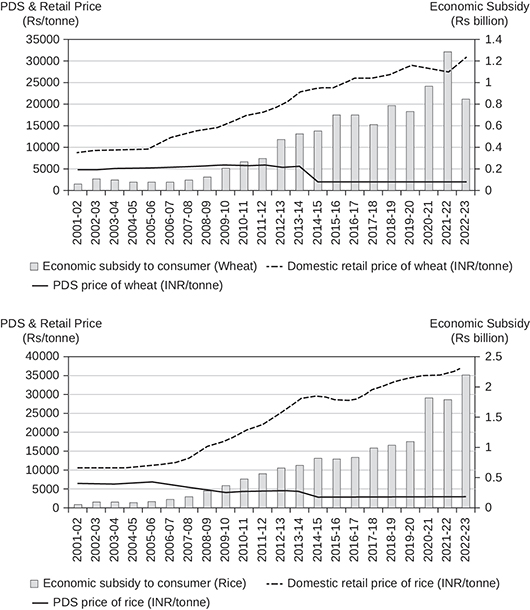
Figure 4 Consumers’ economic subsidy, retail prices, PDS price at current prices – wheat (top) and rice (bottom), 2001–02 to 2022–23, India in nominal rupees and rupees billion
Source: Computed by the authors.
The story is quite different for producers, who have not always received an implicit transfer in the period considered. Further, there is a distinct difference between wheat and rice. While producers mostly receive an implicit (economic) subsidy in the case of wheat, they are implicitly “taxed” in the case of rice because MSP prices of rice are below wholesale prices (Figure 5). This pattern of support is consistent with those represented by other measures used for international comparisons, such as Nominal Protection Coefficients or variations of the commodity-specific Aggregate Measure of Support (AMS) used by the WTO or Producer Support Estimates (Narayanan 2014; OECD-ICRIER 2018; Sharma 2016). Each of these measures estimates the “gap” between prices farmers receive domestically relative to an external reference price, that proxies a counterfactual price the farmers would have received if “free trade” was allowed. The gap then measures whether the farmers are protected (net subsidised) or dis-protected (net taxed). It is worth noting that the idea of “net taxation” matters in the context of discussions of trade policy, especially when trade barriers, particularly on exports, may undermine farmers’ opportunities to sell at a higher global price. However, it is relatively less relevant to the discussion on the magnitude of payments from the government to farmers to support the PDS.
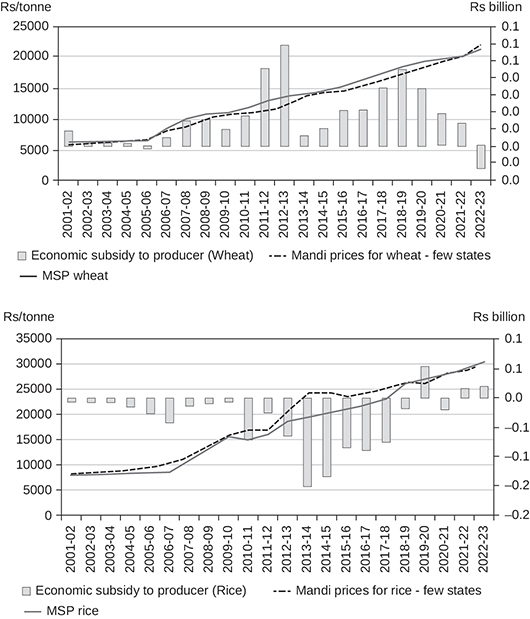
Figure 5 Producers’ economic subsidy, wholesale prices, and minimum support prices at current prices – for wheat (top) and rice (bottom), 2001–02 to 2022–23, India in nominal rupees and rupees billion
Source: Computed by the authors.
The Relationship Between Budgetary (Explicit) and Economic (Implicit) Subsidy on Food
In previous sections, we highlighted the contrast between budgetary subsidy and economic subsidy on food. The two measure different things and have different interpretations. Budgetary subsidies are accounting measures, and we refer to these as explicit because they are reported explicitly in government documents, including the FCI annual reports, reports of the Ministry of Consumer Affairs, Food and Public Distribution and the annual Economic Survey. Ideally, these are not to be construed as a benefit to either consumer or producer, even though it incorporates compensation to producers as part of the costs or “acquisition costs.” It also embodies transfers to consumers if we define these benefits to be the costs of acquiring and distributing grain that is not paid for by the States or the beneficiaries. In contrast, the economic subsidy represents the implicit transfer to producers and consumers, accruing on account of the budgetary subsidy or the food subsidy from the perspective of the producers and consumers. This is an implicit transfer, since this is derived from the difference of price received or paid relative to the alternative/status quo hypothetical counterfactual. Estimates of implicit subsidies are useful if the purpose is to assess the value of in-kind distribution of food to consumers, or the value of public procurement to farmers. That both terms are referred to as subsidy is potentially confusing, especially since they can be vastly different in magnitude and are used to address related but distinct questions.
To see this, Table 2 summarises the concepts discussed so far. Note that the Budgetary Food Subsidy (the “Consumer Food Subsidy”) as such is not separated for consumers and producers since it is an accounting concept from the perspective of the FCI. From a budgetary perspective, or Qprocure is directed to farmers as compensation and the BFS as a whole is the net costs incurred by the government for food subsidy to consumers. We therefore compare the economic subsidy to producers and consumers with these metrics, respectively.
Table 2 A summary of different measures
| Term | What it represents | |
| Budgetary Food Subsidy (BFS) | ||
| Consumer | Producer | |
| Economic subsidy (our approach) | ||
Note: or Qprocure is the budgetary cost of procurement of grains from farmers.
Figure 6 now presents budgetary and economic subsidy for the consumer (top panel) and the producer (bottom panel). For consumers, the latter is larger than the former, suggesting that each rupee incurred by the Government generates gains to consumers that is larger than the cost (ignoring leakages for the moment). For producers on the other hand, the budgetary transfer in the books for grain supplied is larger than the economic subsidy, which means that a rupee spent on food subsidy involves a compensation to the farmer for grains supplied (as illustrated in the previous section) but does not implicitly benefit the farmer relative to their next best alternative.
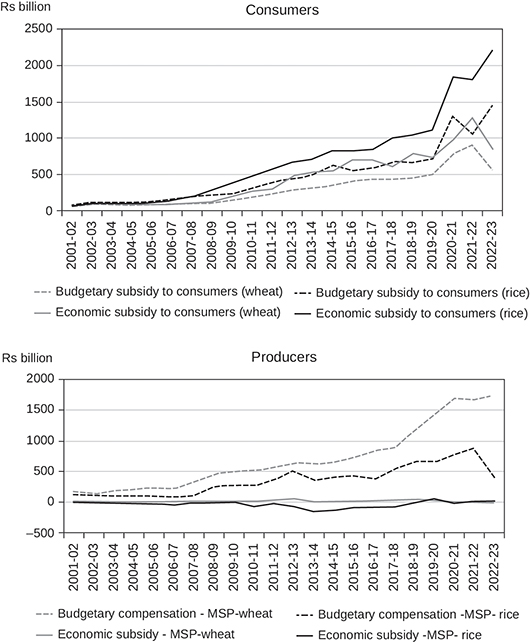
Figure 6 Summary of “budgetary” and “economic” subsidy to consumers and producers), 2001–02 to 2022–23, India in rupees billion
Source: Computed by the authors.
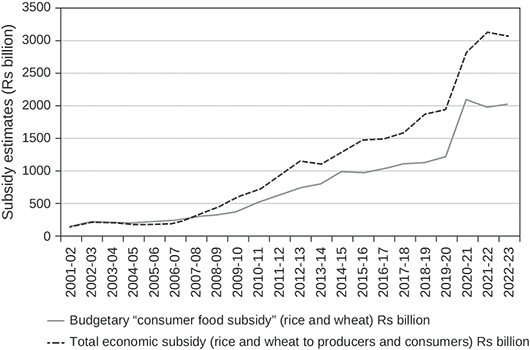
Figure 7 Comparing budgetary and economic subsidy for rice and wheat consumers and producers at current prices, 2001–02 to 2022–23, India in nominal rupees billion
Source: Computed by the authors.
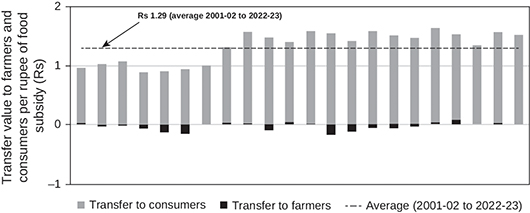
Figure 8 Value of transfers per rupee of total compensation to farmers and consumers 2001–02 to 2022–23, India in rupees
Source: Computed by the authors.
This figure illustrates the apparently conflicting and inconsistent narratives in the public domain. For example, the 2020 farmers’ protests and the 2018 Long March before that, on the one hand, generated discussions on MSPs and relatedly the support that rice and wheat farmers were receiving under procurement operations. On the other hand, reports based on recent OECD estimates and India’s WTO notifications indicate that Indian farmers are “net-taxed” (OECD-ICRIER 2018). Figure 6 suggests that the compensation to farmers under the Budgetary Food Subsidy is indeed large and growing, while the economic subsidy suggests that the payment for grain under procurement operations remains lower than open market prices domestically (and likely international prices), leading to the inference that farmers are net-taxed under the current food subsidy regime.
Estimating the Total Value of Benefits to Consumers and Farmers
So far, we have focused on introducing different ways of conceptualising and measuring subsidies to farmers and consumers and the contexts in which each measure makes sense. Table 2 summarises the different measures of budgetary and economic subsidy under India’s current food subsidy regime to producers and consumers of rice and wheat. This section focuses on bringing together these measures to estimate the total economic subsidy and how it compares with the budgetary food subsidy (BFS) that is reported by the FCI.
In the previous section, we compared these separately for producers and consumers. Another way to compare figures would be by commodity, i.e. comparing the economic subsidy for wheat to consumers and producers with that for rice. Such a comparison shows that the economic subsidy to producers and consumers of rice marginally outstrips that provided to wheat producers and consumers (Table 3).
Table 3 Rice and wheat subsidies compared, 2001–02 to 2022–23, India in rupees billion and per cent
| Year | Wheat | Rice | Share of economic subsidy to wheat producers and consumers (%) | ||||
| Budgetary “consume” subsidy on wheat (Rs billion) | Economic subsidy (wheat) to producers and consumers (Rs billion) | Economic subsidy per Rs of budgetary food subsidy (wheat) (Rs) | Budgetary “consumer” subsidy on rice (Rs billion) | Economic subsidy (rice) to producers and consumers (Rs billion) | Economic subsidy per Rs of budgetary food subsidy (rice) (Rs) | ||
| 2001–02 | 55 | 70 | 1.3 | 74 | 56 | 0.8 | 55 |
| 2002–03 | 89 | 110 | 1.2 | 118 | 94 | 0.8 | 54 |
| 2003–04 | 81 | 103 | 1.3 | 109 | 94 | 0.9 | 52 |
| 2004–05 | 77 | 81 | 1.1 | 118 | 77 | 0.7 | 51 |
| 2005–06 | 76 | 76 | 1.0 | 133 | 84 | 0.6 | 48 |
| 2006–07 | 84 | 85 | 1.0 | 150 | 98 | 0.7 | 47 |
| 2007–08 | 100 | 111 | 1.1 | 193 | 181 | 0.9 | 38 |
| 2008–09 | 97 | 140 | 1.4 | 215 | 274 | 1.3 | 34 |
| 2009–10 | 140 | 214 | 1.5 | 230 | 369 | 1.6 | 37 |
| 2010–11 | 194 | 282 | 1.5 | 306 | 407 | 1.3 | 41 |
| 2011–12 | 228 | 341 | 1.5 | 393 | 548 | 1.4 | 38 |
| 2012–13 | 285 | 533 | 1.9 | 436 | 605 | 1.4 | 47 |
| 2013–14 | 308 | 530 | 1.7 | 487 | 563 | 1.2 | 49 |
| 2014–15 | 344 | 558 | 1.6 | 625 | 693 | 1.1 | 45 |
| 2015–16 | 408 | 721 | 1.8 | 555 | 734 | 1.3 | 50 |
| 2016–17 | 433 | 721 | 1.7 | 586 | 754 | 1.3 | 49 |
| 2017–18 | 424 | 644 | 1.5 | 670 | 925 | 1.4 | 41 |
| 2018–19 | 450 | 830 | 1.8 | 663 | 1028 | 1.6 | 45 |
| 2019–20 | 497 | 766 | 1.5 | 705 | 1160 | 1.6 | 40 |
| 2020–21 | 777 | 984 | 1.3 | 1300 | 1815 | 1.4 | 35 |
| 2021–22 | 908 | 1295 | 1.4 | 1054 | 1820 | 1.7 | 42 |
| 2022–23 | 555 | 832 | 1.5 | 1451 | 2228 | 1.5 | 27 |
| Averages | |||||||
| 2001–02 to 2022–23 | 1.44 | 1.20 | 44 | ||||
| 2001–02 to 2011–12 | 1.26 | 0.99 | 45 | ||||
| 2012–13 to 2022–23 | 1.61 | 1.41 | 42 | ||||
Source: Computed by the authors.
In Table 4, we bring everything together and compute the ratio of the economic subsidy to the stated budgetary “Consumer Food Subsidy” (BFS, in this paper) (as presented in the FCI budgets). This ratio reflects the value of implicit transfers to producers and consumers of rice and wheat per rupee of the stated budgetary subsidy. Recall that the former estimates the “benefits” in a sense to farmers and consumers, the latter the costs to the government, an accounting concept. Our main estimate uses the MSP and actual procurement volumes, but we present estimates using a range of alternative assumptions.
Table 4 A summary of estimates of budgetary and economic subsidy under alternative assumptions, 2001–02 to 2022–23, India in rupees
| Year | Budgetary “consumer” subsidy (rice and wheat) (Rs billion) | Economic subsidy (rice and wheat) to producers and consumers (Rs billion) | Economic subsidy per Re of budgetary consumer subsidy (in Rs) | Economic subsidy per Re of “pure” transactions cost (Rs) | |||
| Using MSP and procurement volumes | Using MSP and offtake | Using pooled costs and procurement volumes | Using pooled costs and offtake | ||||
| 2001–02 | 130 | 126 | 0.97 | 0.98 | 1.14 | 1.08 | 0.68 |
| 2002–03 | 206 | 204 | 0.99 | 0.97 | 1.10 | 1.14 | 0.99 |
| 2003–04 | 190 | 197 | 1.04 | 1.04 | 1.23 | 1.24 | 1.09 |
| 2004–05 | 195 | 158 | 0.81 | 0.82 | 0.98 | 0.97 | 0.80 |
| 2005–06 | 209 | 159 | 0.76 | 0.77 | 0.99 | 0.97 | 0.81 |
| 2006–07 | 234 | 183 | 0.78 | 0.79 | 0.78 | 0.77 | 0.76 |
| 2007–08 | 293 | 293 | 1.00 | 1.01 | 0.89 | 0.90 | 1.17 |
| 2008–09 | 312 | 414 | 1.33 | 1.32 | 1.12 | 1.17 | 1.09 |
| 2009–10 | 370 | 583 | 1.58 | 1.58 | 1.33 | 1.36 | 1.41 |
| 2010–11 | 500 | 689 | 1.38 | 1.40 | 1.30 | 1.32 | 1.52 |
| 2011–12 | 621 | 889 | 1.43 | 1.43 | 1.30 | 1.31 | 1.59 |
| 2012–13 | 721 | 1137 | 1.58 | 1.57 | 1.40 | 1.40 | 1.63 |
| 2013–14 | 795 | 1093 | 1.38 | 1.39 | 1.26 | 1.27 | 1.66 |
| 2014–15 | 969 | 1251 | 1.29 | 1.30 | 1.19 | 1.20 | 1.66 |
| 2015–16 | 963 | 1455 | 1.51 | 1.52 | 1.44 | 1.45 | 1.87 |
| 2016–17 | 1019 | 1475 | 1.45 | 1.47 | 1.37 | 1.38 | 1.91 |
| 2017–18 | 1093 | 1569 | 1.43 | 1.43 | 1.39 | 1.39 | 2.01 |
| 2018–19 | 1114 | 1858 | 1.67 | 1.67 | 1.55 | 1.57 | 2.07 |
| 2019–20 | 1203 | 1926 | 1.60 | 1.58 | 1.50 | 1.51 | 1.68 |
| 2020–21 | 2078 | 2798 | 1.35 | 1.35 | 1.29 | 1.29 | 1.88 |
| 2021–22 | 1962 | 3115 | 1.59 | 1.59 | 1.52 | 1.52 | 2.80 |
| 2022–23 | 2007 | 3060 | 1.52 | 1.52 | 1.46 | 1.44 | 2.89 |
| Averages | |||||||
| 2001–02 to 2022–23 | 1.29 | 1.29 | 1.25 | 1.26 | 1.54 | ||
| 2001–02 to 2011–12 | 1.10 | 1.10 | 1.10 | 1.11 | 1.08 | ||
| 2012–13 to 2022–23 | 1.49 | 1.49 | 1.40 | 1.40 | 1.97 | ||
Source: Authors’ calculations.
Our estimates suggest that, on average, between 2001 and 2022, each rupee of the Budgetary “Consumer Food Subsidy” or BFS corresponded to Rs 1.29 worth of benefits to producers and consumers of rice and wheat, i.e. it cost Rs 0.77 to transfer a rupee worth of benefits to producers and consumers. As evident from Table 4, the popular narratives of the early years that it costs more than a rupee to transfer a rupee worth of benefits holds only for the initial years in the period studied.
We now alter several of the assumptions underpinning these estimates to provide a range of estimates. First, we assume that the price paid is equal to pooled costs, because the actual MSP paid out might be different from the announced MSP on account of variations at the state level in price paid to farmers. This does not alter these estimates significantly (Table 4). Second, we assume that the quantity procured is restricted to only what is required for distribution and re-estimate these ratios Finally, we compare the economic subsidy relative to only procurement incidentals that represents the transactions costs of acquisition and distribution (i.e., does not include compensation to farmers). This provides a perspective of one aspect of operational efficiency of the food subsidy regime. This represents the value of benefits per rupee of transactions costs (i.e., not accounting for compensation to farmers). These estimates too, are as one would expect, higher than our main estimate (at Rs 1.54 per rupee of transactions costs).
Caveats and Limitations
Our analysis comes with many caveats. First, as mentioned already, this analysis is for India as a whole and masks the variations across contexts within India. In that sense, the estimates provided here illustrate a concept and estimate ballpark values of transfers relative to costs and can be further developed with more granular analysis and nuance. Secondly, as noted briefly earlier, we do not consider the allocations made by State governments to food, and hence the budgetary food subsidy we consider are those reported by the Central Government.
Thirdly, on account of our choice of domestic prices rather than international prices as reference prices, when the latter are higher than domestic prices, farmers who are apparently net-taxed might in fact be taxed even more. This aspect is a bone of contention for farmers, who often argue against export bans. Likewise, the extensive debates about whether the MSP is above or below the market price and the contexts in which procurement should ideally take place for MSP to serve as the price floor is important. This aspect is also not discussed in this paper.
Fourthly, we present our analysis throughout in nominal terms, primarily because we are interested in relative values, of total transfer per rupee of BFS, and so on. Thus, although we present time trends of subsidies, the focus is not on growth but on the relationship between BFS, economic subsidy, and our proposed approach.
Fifthly, any comparison of prices, such as those used in the study, overlooks the general equilibrium effects of procurement policies that affect these prices (GoI 2003). The open market and retail prices that farmers and consumers face respectively are themselves determined or influenced by stockholding, in-kind distribution, and open market sales by the Government, world prices, and external trade policies at a given point of time.
Sixthly, we do not account for leakages, which have declined over the years but may still be too large to ignore (Khera 2024).
Our analysis does not adequately address these questions. With these caveats and limitations in mind, we now summarise and conclude our discussion.
Concluding Remarks
Our paper presents a case for revisiting estimates of food subsidies in India. Our contention is that existing estimates of cost-benefit ratios associated with budgetary food subsidies are not only dated but provide a partial and incomplete view of the costs and benefits of the current food subsidy regime and underestimate the true extent of transfers to consumers and farmers. Debates on the form of food aid need to be based on a clearer understanding of these estimates.
Towards this end, we present a range of alternate estimates, elaborating on what each of these mean. The range of metrics presented in this paper illustrate the diverse ways in which publicly available data can be used to examine the current food policy regime, each borne out of different conceptualisations and perspectives of what constitutes benefits and costs to various stakeholders. It underscores the pitfalls of computing cost-benefit type ratios using budgetary numbers without giving due consideration to the specific architecture of the food subsidy regime. We started by first distinguishing the concept of economic subsidy from budgetary subsidy and noting that interpreting budgetary subsidy as transfers to consumers neglects a key aspect of the system that also involves farmers as key stakeholders.
This approach shows that each rupee of the food subsidy reported in government accounts represents a transfer worth Rs 1.29 to consumers and farmers, on average, for the period 2001–02 to 2022–23; i.e. each rupee transferred to these groups is associated with a cost of Rs 0.79 to the government.
We present estimates under alternative assumptions around procurement volumes, and transactions costs to illustrate their implications for cost-effectiveness of subsidies.
These estimates currently point to key insights. First, although farmers’ share in the costs of procurement is overwhelmingly large, in terms of economic subsidy, they are often paid less than the market rate. The consumers’ share of the total subsidies is rising and the rise in economic subsidies to producers and consumers of rice and wheat is driven virtually entirely by the transfers to consumers. This suggests that consumers have consistently been protected against inflation. Among the various approaches to overhauling the food subsidy regime, avoiding excessive procurement (that results in savings in carrying costs) delivers significant improvement in cost-effectiveness.
Overall, this paper offers a cautionary note regarding using budgetary figures on food subsidy to make assessments of the cost-effectiveness of the PDS and makes a case for replacing it with cash transfers based on these estimates. A more useful approach would be to explicitly understand the costs of the system alongside the economic subsidies (or “taxes”) to the two key stakeholders – consumers and farmers.
Acknowledgements: We thank Sashin Poddar and Aman Krishna for their excellent assistance in this research. We are extremely grateful to Annelies Deuss who contributed significantly to the conceptualisation and execution of this paper and to Jean Drèze, Reetika Khera, and the anonymous reviewers for their critical inputs and insights. All errors remain the authors’.
Notes
1 The opposition reflect several other concerns as well. For example, some have asked if this is the best way to achieve its goals or whether the Public Distribution System (PDS) can be replaced by cash transfers or food coupons (Kapur et al. 2008; Kapur 2011; Kotwal et al. 2011). Others believe that India’s policy would have to be more in conformity with the World Trade Organization (WTO)’s Agreement on Agriculture since public procurement of grains has implications for India’s WTO commitments (Hoda and Gulati (2013), for example) and overstocking (Saini and Kozicka 2014). Leakages and fraud too have been key concerns (Jha et al. 2013). Recent discussions have also attempted to estimate the “true” costs of food subsidies in India factoring in environmental consequences of rice and wheat procurement (Puri and Pingali (2024), for instance). We deem some of these concerns to be beyond the scope of this paper.

2 It goes without saying that the distinction of producers and consumers is somewhat artificial since many producers (i.e. farmers) may themselves be net consumers of food grain. We ignore these nuances for the sake of expository ease.
3 Further, it is worth noting that this price is not always an effective support price; nor does it compensate producers for the cost of production recommended, for example, by the Swaminathan Commission. This aspect is beyond the scope of this paper.
4 The government may also incur a fiscal cost when it sells the procured stocks at a price lower than the cost of acquisition (procurement price plus other incidentals) when it conducts Open Market Sales. While this too enters the books as a subsidy, we do not dwell on this aspect.
5 While State governments also subsidise food, here we focus exclusively on the Central Government food subsidy as reported in the budgets. For State Governments, the subsidy would be the costs they incur in acquiring stocks from the Central Government at the Central Issue Price (CIP) and the distribution of these to the network of fair price shops within the State minus the recovery from consumers as the PDS price.
6 Here we focus on just consumers and farmers. In reality, traders and millers, who may mediate some of these transactions, are also stakeholders in this system. We do not evaluate implicit transfers to them.
7 It is worth noting that under the levy system when millers were mandated to procure rice for the public distribution system, this option did not exist (see Press Information Bureau (2015)).
References
| Balakrishnan, Pulapre, and Ramaswami, Bharat (2002), “Food Prices and the Efficiency of Public Intervention: The Case of the Public Distribution System in India,” Food Policy, vol. 27, pp. 419–36.
| |
| Basu, Kaushik (2011), “India’s Foodgrains Policy: An Economic Theory Perspective,” Economic and Political Weekly, vol. 46, no. 5, pp. 37–45 available at https://www.jstor.org/stable/27918088, viewed on April 1, 2013.
| |
| Panagariya, A., and Bhagwati, J. (2014), India’s Tryst with Destiny, HarperCollins Publishers India.
| |
| Chand, Ramesh (2003), “Government Intervention in Foodgrain Markets in the New Context,” Policy paper 19, National Centre for Agricultural Economics and Policy Research Indian Council of Agricultural Research (NCAP-ICAR), New Delhi, India.
| |
| Chakrabarti, Suman, and Rajkhowa, Pallavi (2015), “What Is the Cost of Providing One Rupee of Support to the Poor? Assessing the ‘New’ PDS,” Economic and Political Weekly, vol. 50, no. 52, pp. 83–91.
| |
| Deaton, Angus (2015), “Statement by Angus Deaton to the Indian Press,” Oct 15, South Asia Citizen’s Web, available at http://www.sacw.net/article11783.html, viewed on October 21, 2015.
| |
| Desai, B. M., D’Souza, E., and Namboodri, M. V. (2014), “Review of Food Subsidy Concept, Rationale, Implementation Design and Policy Reforms,” “Review of Rural Affairs,” Economic and Political Weekly, vol. 49, no. 52, pp. 36–44.
| |
| Dev, S. Mahendra (1998), “Public Distribution System: Impact on Poor and Options for Reform,” Economic and Political Weekly, vol. 33, no. 35, pp. 2285–90.
| |
| Drèze, Jean, and Khera, Reetika (2013), “Rural Poverty and the Public Distribution System,” Economic and Political Weekly, vol. 48, no. 45 and 46, pp. 55–60.
| |
| Drèze, Jean, and Khera, Reetika (2017), “Recent Social Policy Initiatives in India,” World Development, vol. 98, pp. 555–72.
| |
| Drèze, Jean (2019), Sense and Solidarity: Jholawala Economics for Everyone, Permanent Black.
| |
| Government of India (GoI) (2003), Report of the High Level Committee on Long Term Grain Policy, chaired by Sen, Abhijit, available at https://www.indiabudget.gov.in/budget_archive/es2002-03/chapt2003/chap519.pdf, viewed on November 10, 2025.
| |
| GoI (2013), The National Food Security Act, 2013, September 10, 2013, available at https://www.indiacode.nic.in/bitstream/123456789/2113/1/201320.pdf, viewed on August 6, 2025.
| |
| GoI (2021), The Economic Survey 2020–21, Ministry of Finance, Government of India, viewed on April 20, 2021.
| |
| Gulati, Ashok, and Narayanan, Sudha (2003), The Subsidy Syndrome in Indian Agriculture, Oxford University Press, New Delhi.
| |
| Gulati, A., Gujral, J., and Nandakumar, T. (2012), “Food Subsidy Bill Can Be Lowered by Rs 2 Lakh Crore Through Cash Transfers,” The Economic Times, January 12, 2012, available at https://economictimes.indiatimes.com/opinion/et-commentary/food-subsidy-bill-can-be-lowered-by-rs-2-lakh-crore-through-cash-transfers/articleshow/11456207.cms?from=mdr, viewed on April 1, 2013.
| |
| Gupta, P., Khera, R., and Narayanan, S. (2021), “Minimum Support Prices in India: Distilling the Facts,” Review of Agrarian Studies, vol. 11, no. 1, available at http://www.ras.org.in/minimum_support_prices_in_india, viewed on April 1, 2022.
| |
| Himanshu, and Sen, Abhijit (2013), “In-Kind Food Transfers — I: Impact on Poverty,” Economic and Political Weekly, vol. 48, no. 45/46, pp. 46–54, available at http://www.jstor.org/stable/23528608, viewed on October 2, 2022.
| |
| Himanshu, and Sen, Abhijit (2013), “In-Kind Food Transfers — II: Impact on Nutrition and Implications for Food Security and Its Costs,” Economic and Political Weekly, vol. 48, no. 47, pp. 60–73, available at http://www.jstor.org/stable/23528643, viewed on October 2, 2022.
| |
| Hoda, Anwarul, and Gulati, Ashok (2013), “India’s Agricultural Trade Policy and Sustainable Development,” International Centre for Trade and Sustainable Development (ICTSD) Programme on Agricultural Trade and Sustainable Development, Issue paper no. 49, ICTSD, Geneva, Switzerland, available at https://www.greenpolicyplatform.org/sites/default/files/downloads/resource/indias-agricultural-trade-policy-sustainable-development-ICTSD.pdf, viewed on April 1, 2015.
| |
| Jha, S., Kotwal, A., and Ramaswami, B. (2013), “Safety Nets and Food Programmes in Asia: A Comparative Perspective,” ADB Economics Working Paper Series, no. 371, Asian Development Bank, available at https://www.adb.org/sites/default/files/publication/30387/ewp-371.pdf, viewed on April 1, 2015.
| |
| Kapur, D., Mukhopadhyay, P., and Subramanian, A. (2008), “More for the Poor and Less for and by the State: The Case for Direct Cash Transfers,” Economic and Political Weekly, vol. 43, no. 15, pp. 37–41, available at https://www.jstor.org/stable/40277336, viewed on April 1, 2013.
| |
| Kapur, Devesh (2011), “The Shift to Cash Transfers: Running Better But on the Wrong Road?” Economic and Political Weekly, vol. 46, no. 21, pp. 80–5.
| |
| Khera, Reetika (2024), “Impact of the Food Security Act on Public Distribution System, Perspectives,” Ideas for India, Oct 3, available at https://www.ideasforindia.in/topics/poverty-inequality/impact-of-the-food-security-act-on-public-distribution-system.html, viewed on October 3, 2024.
| |
| Kotwal, A., Murugkar, M., and Ramaswami, B. (2011), “PDS Forever?” Economic and Political Weekly, vol. 46, no. 21, pp. 72–6, available at http://www.jstor.org/stable/23017229, viewed on April 1, 2013.
| |
| Mishra, Prachi (2013), “Financial and Distributional Implications of the Food Security Law,” Economic and Political Weekly, vol. 48, no. 39, pp. 28–30.
| |
| Nandakumar, T. (2020), “Union Budget 2021–22: The Burgeoning Food Subsidy Bill Will Be a Key Budget Worry,” Dec 23, Financial Express, available at https://www.financialexpress.com/opinion/union-budget-2021-22-the-burgeoning-food-subsidy-bill-will-be-a-key-budget-worry/2155584/, viewed on December 23, 2020.
| |
| Narayanan, Sudha (2014), “The National Food Security Act vis-à-vis the WTO Agreement on Agriculture,” Economic and Political Weekly, vol. 49, no. 5, pp. 40–46.
| |
| Narayanan, Sudha, and Gerber, Nicolas (2017), “Social Safety Nets for Food and Nutrition Security in India,” Global Food Security, available at https://doi.org/10.1016/j.gfs.2017.05.001, viewed on December 20, 2017.
| |
| Organisation for Economic Co-operation and Development and the Indian Council for Research on International Economic Relations (OECD-ICRIER) (2018), “Agricultural Policies in India,” OECD Food and Agricultural Reviews, OECD Publishing, Paris, available at https://www.oecd.org/en/publications.html, viewed on September 14, 2020.
| |
| Press Information Bureau (2015), “Levy on Rice Reduced to Encourage Direct Procurement from Farmers,” Ministry of Consumer Affairs, Food and Public Distribution, GoI, May 8, 2015, available at https://www.pib.gov.in/newsite/PrintRelease.aspx?relid=121421, viewed on October 6, 2025.
| |
| Puri, Raghav, and Pingali, Prabhu (2024), “Reducing the True Cost of Food-based Safety Nets: Evidence from India’s Subsidized Food Programme,” “Focus on Sustainable Food Systems Transformation,” Environmental Research Letters, vol. 19, no. 6, available at doi: 10.1088/1748-9326/ad4b48, viewed on June 5, 2025.
| |
| Radhakrishna, R., Subbarao, K., Indrakant, S., and Ravi, C. (1997), “India’s Public Distribution System: A National and International Perspective,” World Bank discussion paper no. 380, The World Bank, Washington, D. C.
| |
| Rahman, Andaleeb, and Pingali, Prabhu (2024), “Food Policy: A Case of Punctuated Equilibrium,” in The Future of India’s Social Safety Nets, Palgrave Studies in Agricultural Economics and Food Policy, Palgrave Macmillan, Cham, available at https://doi.org/10.1007/978-3-031-50747-2_5, viewed on June 5, 2025.
| |
| Saini, Shweta, and Kozicka, Marta (2014), “Evolution and Critique of Buffer Stocking Policy of India,” Working paper no. 283, ICRIER, New Delhi.
| |
| Sharma, Sachin Kumar (2016), The WTO and Food Security, Springer, available at doi: 10.1007/978-981-10-2179-4, viewed on December 5, 2017.
| |
| Sharma, Vijay Paul, and Alagh, Munish (2013), “Food Subsidy in India: Its Components, Trends, Causes and Reforms for Public Policy,” 2nd ed., vol. 68, Indian Journal of Agricultural Economics, pp. 196–221.
| |
| Sinha, Dipa (2015), “Food Security in India: The Challenges of Ensuring Nutrition for All,” IDS Bulletin, vol. 46, no. 3, pp. 93–103.
| |
| Svedberg, Peter (2012), “Reforming or Replacing the Public Distribution System with Cash Transfers?” Economic and Political Weekly, vol. 47, no. 7, pp. 53–62.
| |
| Swaminathan, Madhura (1999), “Understanding the Costs of the Food Corporation of India,” Economic and Political Weekly, vol. 34, no. 52, pp. A121–A132, available at www.jstor.org/stable/4408768, viewed on December 5, 2017.
| |
| Swaminathan, Madhura (2000a), “Consumer Food Subsidies in India: Proposals for Reform,” The Journal of Peasant Studies, vol. 27, no. 3, pp. 92–114, available at doi: 10.1080/03066150008438741, viewed on December 5, 2017.
| |
| Swaminathan, Madhura (2000b), Weakening Welfare: The Public Distribution of Food in India, LeftWord Books.
| |
| United States Department of Agriculture-Economic Research Service (1994), “Estimates of Producer and Consumer Subsidy Equivalents: Government Intervention in Agriculture, 1982–92,” United States Department of Agriculture, Washington, D. C.
|