

ARCHIVE
Vol. 15, No. 2
JULY-DECEMBER, 2025
Editorial
Research Articles
Referees
Patterns of Diversification in Rural Household Incomes: Evidence from a Longitudinal Study in Uttar Pradesh
*Associate Professor, Bihar Institute of Public Finance and Policy, Patna
†Centre for Economic Data and Analysis, Ashoka University, Sonipat
https://doi.org/10.25003/RAS.15.02.0008
Abstract: This paper draws on longitudinal household survey data to examine changes in household incomes in two villages in Uttar Pradesh between 2006 and 2023. The paper explores shifts in the growth and composition of household incomes across various socio-economic strata, and on the contributions of different income sources. While agricultural activities remain important, the findings show a gradual diversification towards non-farm employment across different socio-economic classes. The paper also uses Simpson’s Index of Diversity to examine income diversification, highlighting diversification patterns across socio-economic classes and over time. The research contributes to the limited literature on rural household income dynamics in India, studies on which have been constrained by a lack of disaggregated, source-wise data on income.
Keywords: Rural household income dynamics, income diversification, non-farm employment, labour migration and remittances, agrarian class structure, caste and income mobility, longitudinal study
Introduction
This article presents a comparative analysis of household incomes in two villages of Uttar Pradesh. It aims to capture the changes in the level and composition of household incomes across different social strata from 2006 to 2023 and examines the changes in income growth over this 17-year period. The article focuses on the degree of diversification in income sources and the role of non-farm economic activities among various socio-economic classes and caste groups.
The literature on household incomes among agrarian households has been scarce, primarily due to a lack of statistics on source-wise income levels in India. Further, rural economies in particular are predominantly informal in nature. In these informal settings, especially within agrarian economies, the interplay between monetised and non-monetised variables complicates the calculation of incomes from various sources, making the task a complex one, theoretically and operationally.
The Foundation for Agrarian Studies (FAS) initiated village studies under the Project on Agrarian Relations in India (PARI) in the early 2000s. In recent years, FAS has resurveyed some of the villages first studied in the early 2000s. Two villages in Uttar Pradesh – Mahatwar and Harevli – were surveyed for the first time in 2006 and resurveyed in 2023 (see Dhar (2025)).
Over the years, FAS has developed what we believe to be a robust methodology to calculate household incomes from different sources, one that comes to grips with the complexities of this task with respect to data from rural India (FAS 2015). Income under this method is a derived variable, computed using disaggregated data from different modules of FAS’s PARI (FAS-PARI) survey schedules, which seek to capture all the income flows, in cash and kind, that make up aggregate household income. The household-level schedule consists of 12 distinct modules designed to collect data on income. One of the key components of income, crop income, is calculated using the concepts and definitions broadly defined by the Commission for Agricultural Costs and Prices (CACP).1
The analysis of household income growth in rural India has historically been limited by the scarcity of longitudinal data and the informal nature of rural economies, which often results in the underreporting and misclassification of income sources (Himanshu 2010; Deaton and Kozel 2005). Despite these challenges, an expanding body of empirical literature has explored household income dynamics, livelihood diversification, and income inequality within agrarian contexts. Classic studies on agrarian relations, such as that by Ramachandran (1990), have highlighted the stratified nature of rural society, particularly the unequal ownership of productive assets such as land. These inequalities manifest in divergent income patterns across different classes and caste groups. The landlord and big capitalist farmer classes typically derive their income from land rent and capital-intensive agriculture, while smallholders and manual workers rely on wage labour or migration (Ramachandran et al. 2008; Dhar et al. 2022).
Recent studies have emphasised the increasing significance of non-farm income sources – including construction, manufacturing, trade, services, and migration – in shaping rural household incomes (Ellis 2000; Lanjouw and Shariff 2004). Livelihood diversification has been particularly crucial for lower peasant households and oppressed-caste households as a coping strategy in response to stagnating agricultural returns and landlessness (Srivastava and Sasikumar 2003). The rise of rural non-farm employment has implications for class and caste mobility (Himanshu et al. 2013). However, the extent to which diversification leads to upward mobility remains contested and is influenced by factors such as education, caste discrimination, and access to credit (Deshpande 2011; Binswanger-Mkhize 2013).
The villages in which FAS conducted census surveys in 2006 were Mahatwar in Ballia district in eastern Uttar Pradesh and Harevli in Bijnor district in western Uttar Pradesh. These were resurveyed in June 2023 using a similar methodology. Using data from these two rounds, we constructed household panels. Before we analyse various aspects of household incomes, we first briefly highlight some limitations of the data.
The data on household incomes for landlords and big capitalist farmers and other rich sections of the villages understate incomes. Below are some reasons for this underestimation.
First, we observed the division of land and sub-division of households between 2006 and 2023, particularly in Harevli. This sub-division of households and division of means of production has led to the downscaling of crop production.
Secondly, the educated working-age individuals from landlord and big capitalist farmer households were employed in high-paying jobs in cities or owned businesses in urban centres. These migrants were not a part of the household and did not remit funds regularly unless the household of origin needed money for asset creation or other reasons. Their irregular but substantial remittances could not be captured in a one-time survey. For instance, consider the case of a Tyagi family in Harevli which split into three nuclear households following the 2006 survey. This family began accumulating assets in the early 2000s and purchased 10 bighas (6.20 acres) of agricultural land. After the division of households, one of the households acquired two residential plots in Ghaziabad, valued at Rs 1.4 crores (Rs 14 million) in 2010. Among the three sons, two, along with their wives, migrated from the village and secured employment in well-paying corporate jobs. Since they were no longer part of the household, they did not send regular remittances. However, they made significant financial contributions towards the aforementioned land purchases. This pattern underscores the irregular yet substantial nature of remittances from high-earning migrants, which often go undetected in one-time household surveys. In contrast, labour migrants tend to have regular remittance patterns allowing accurate tracking of these contributions.
Thirdly, landlord and big capitalist farmers and rich peasants diversified their income portfolios towards financial assets, such as equities and mutual funds. In FAS surveys, information on financial assets is not collected. This omission is a significant source of underestimation of household incomes.
The incomes of landlord and big capitalist farmer plus rich peasant households, while underestimated, still give a broad picture of the economic conditions in which they live relative to others in the village.
Given the aforementioned limitations, the incomes of the class of landlord and big capitalist farmers in Harevli have not been presented in the statistical tables, nor has their income profile been analysed in comparison to other socio-economic classes. The quantitative information related to this class has been used descriptively to explain their economic well-being, without making any comparisons to other socio-economic classes. In contrast, in Mahatwar, the landlord class has been included in the statistical analysis alongside other socio-economic classes, as this class is in decline and information about income shares from different sources was captured fairly accurately in the survey. Although they possess wealth – primarily in the form of land – they do not exhibit the highly remunerative income and asset profiles observed in Harevli.
In the following sections, we use the socio-economic classification proposed by Dhar (2025, this issue). For the comparative analysis, all income levels were adjusted using the consumer price index for agricultural labour (CPI-AL) at the state level to 2022–23 prices.
Growth and Composition of Household Incomes
Mahatwar
The village economy (aggregate increase of all resident households) grew at a rate of 6.1 per cent per annum between 2006 and 2023 (see Table 1). The primary driver of income growth was the non-agricultural sector, which includes construction, manufacturing, and services. During this period, the annual growth of income from non-agricultural activities was 7.2 per cent while agricultural income increased at a negligible rate of 0.2 per cent per annum. Among socio-economic classes, the highest income growth (10.7 per cent) was recorded by the class dependent on remittances, pensions, and small rents. However, this group constituted a small proportion of households in the village. Among the agrarian classes, the class of lower peasants experienced the highest growth at 8.9 per cent per annum. Among the agrarian classes, middle and lower peasants experienced the highest growth rate in non-agricultural income, each at 9.9 per cent. However, the sources of non-agricultural income differed significantly between these classes. The primary sources of non-agricultural income for lower peasants were remittances from migrant workers, who were mostly engaged in the informal sector and petty businesses. For middle peasants, the sources of non-agricultural income ranged from government salaries, pensions of retired government employees, remittances from migrants in blue-collar and white-collar jobs, to petty businesses.
Table 1 Growth of agricultural and non-agricultural incomes, by socio-economic class, Mahatwar, 2006 and 2023 in per cent
| Socio-economic class | Compound annual growth rate (CAGR) of income | ||
| Agriculture | Non-agriculture | All | |
| Landlord | –5.8 | –2.8 | –3.9 |
| Rich peasant | –1.9 | 7.4 | 5.2 |
| Middle peasant | 3.8 | 9.9 | 7.8 |
| Lower peasant | 3.3 | 9.9 | 8.9 |
| Manual worker | 1.6 | 6.7 | 6.2 |
| Business activity/Self-employment | 3.7 | 9.4 | 9.2 |
| Salaried person/s | –0.6 | 10.0 | 9.6 |
| Remittances, pensions, small rents | 3.6 | 11.1 | 10.7 |
| All classes | 0.2 | 7.2 | 6.1 |
Note: For a description of socio-economic classes, see Dhar (2025).
Source: Project on Agrarian Relations in India (PARI) survey data, 2006 and 2023.
The income growth was negative for the landlord class over the years. These households leased out their land for rent. In 2023, 20 per cent of households leased out a part or all of their agricultural land compared to 4.6 per cent in 2006 (Das et al. 2024). Of the total operated land, 38 per cent was land leased in by cultivators in 2023, as compared to 16 per cent in 2006 (Das et al. 2024). Nevertheless, they retained ownership of the land, anticipating a profitable sale in the future as land prices rose. Intuitively, these households may have ceased cultivation to pursue more lucrative economic activities primarily outside the village. Income derived from such sources was either underestimated or not reported at all during the survey. Furthermore, the number of landlord households in any given village was numerically insignificant, making it impossible to obtain a statistically robust estimate. A similar pattern of income growth was also observed among rich peasants.
The share of income derived from agriculture (from crop production and livestock) drastically decreased for all agrarian classes between 2006 and 2023: from 22 per cent in 2006 to 8.4 per cent in 2023 (see Table 2). The proportion of income from crop production declined from 11.3 per cent in 2006 to 4.3 per cent in 2023. The share of income from animal resources decreased to 4.1 per cent in 2023, down from 10.7 per cent in 2006.
Table 2 Share of income from different sources, by socio-economic class, Mahatwar, 2006 and 2023 in per cent
| Socio-economic classes | Crop production | Livestock | Agricultural labour | Non-agricultural casual labour | Salaries and pension | Business | Remittances | Rental income | Others | |||||||||
| 2006 | 2023 | 2006 | 2023 | 2006 | 2023 | 2006 | 2023 | 2006 | 2023 | 2006 | 2023 | 2006 | 2023 | 2006 | 2023 | 2006 | 2023 | |
| Landlord/Big farmer | 23.5 | 19.9 | 17.9 | 9.7 | 0 | 0 | 0 | 0 | 16.6 | 29.4 | 31.5 | 30.9 | 0 | 0 | 8.7 | 8.1 | 1.8 | 1.9 |
| Rich peasant | 24.8 | 8.8 | 11.7 | 2.3 | 0 | 0 | 2.8 | 0.7 | 7.1 | 55.9 | 4.3 | 22.7 | 8.6 | 5.2 | 0.2 | 2.6 | 40.6 | 1.8 |
| Middle peasant | 25.4 | 14.1 | 18.9 | 9.5 | 0.7 | 0 | 15.2 | 10.1 | 9.5 | 29.8 | 8.7 | 16.4 | 13.4 | 14.9 | 3.1 | 1.2 | 5 | 4.1 |
| Lower peasant | 3.1 | 2.4 | 13.7 | 6.8 | 5.7 | 0 | 26.2 | 6 | 6 | 21.6 | 9.9 | 25.1 | 4.5 | 25.2 | 0 | 0 | 30.8 | 12.8 |
| Manual worker | 1.4 | 1.7 | 6.5 | 3.4 | 6.3 | 1.7 | 27.6 | 26.2 | 3.6 | 11.4 | 0 | 5 | 5 | 26.9 | 0 | 0.1 | 49.5 | 23.6 |
| Artisan work and work at traditional caste calling | 0.5 | 5.9 | 0.0 | 0 | 0 | 66.4 | 27.2 | 0 | 0 | |||||||||
| Business activity/self-employed | 1.1 | 0.1 | 5.2 | 2.7 | 0.5 | 0 | 0.7 | 0 | 2.3 | 0.2 | 72.1 | 88.3 | 0 | 7.3 | 0 | 0 | 18.2 | 1.3 |
| Salaried person/s | 4.7 | 1.1 | 3.7 | 0.6 | 0.1 | 0 | 0 | 5.4 | 88 | 61.2 | 0 | 22.1 | 3.5 | 1.7 | 0 | 0.2 | 0 | 7.8 |
| Remittances/pensions/rental income | 2.9 | 1 | 5.2 | 1.6 | 0 | 0 | 1.1 | 0 | 35.1 | 38 | 1.9 | 2.6 | 35.7 | 47.7 | 1.9 | 8.5 | 16.1 | 0.6 |
| All classes | 11.3 | 4.3 | 10.7 | 4.1 | 1.5 | 0.3 | 8.4 | 7.8 | 15.6 | 28 | 25 | 25.5 | 6.3 | 19.6 | 1.9 | 1.9 | 19.5 | 8.4 |
Source: PARI survey data, 2006 and 2023.
The class of landlord/big farmers experienced a significant shift in income sources, transitioning primarily from crop production and livestock resources to salaries and pensions. The share of income derived from agriculture for this group fell from 41.4 per cent in 2006 to 29.6 per cent in 2023. The decline in income from animal resources has been striking: the share of income from animal resources decreased from 17.9 per cent in 2006 to 9.7 per cent in 2023.
The proportion of income derived from agriculture for peasant classes fell from a range of 16.8–44.3 per cent in 2006 to 11.1–23.6 per cent in 2023. All peasant classes experienced a decrease in the share of income from crop production and livestock in their total incomes in 2023 as compared to 2006. In Mahatwar village, the lower peasant class, primarily consisting of tenant cultivators who leased land from the landlord/big farmers and other landowners, incurred losses in crop production due to high rent and input costs (Das et al. 2024). As a result, these households often received low or even negative incomes from crop production.
For agrarian classes, the sources of income have shifted away from agriculture. The upper segment of the peasantry (rich and middle peasants) diversified their income sources towards salaried employment in both public and private sectors, as well as business ventures. Between 2006 and 2023, income from salaries, pensions, and business ventures significantly increased for these classes. Specifically for rich peasants, salaries and pensions contributed only 7.1 per cent of household incomes in 2006 but rose to 55.9 per cent in 2023. For both classes, business in the village and nearby towns increased significantly in recent years.
Among the non-farm sources of income, remittances saw a steep increase as a share of total household income. At the village level, the share of remittances in aggregate household income was 6.3 per cent in 2006, which increased to 19.6 per cent in 2023. For lower peasant and manual workers, remittances from migration – primarily labour migration – emerged as the most significant source of income. Jatava households received remittances from migrant wage workers employed in the informal sector. In 2023, 49 per cent of Jatava households received remittances as compared to 13 per cent in 2006 (Das et al. 2024). At the time of our survey, workers from Mahatwar had migrated to the National Capital Region (NCR), Gujarat, Maharashtra, and Uttar Pradesh. In this village, the structure of income-generating activities underwent significant changes over the 17-year period: for peasants, salaries, pensions, and business income became the dominant sources of household income; for labouring poor manual worker and a large section of the lower peasant class, a significantly large share of income came from labour migration and non-agricultural wage work. Agriculture contributed less than 23 per cent of the household income for the peasant classes. Furthermore, agricultural wage labour was already low in 2006 for lower peasants and manual workers; it has since declined further, becoming negligible in the composition of household income.
Among manual workers, several men in Mahatwar engaged in the specialised occupation of digging borewells in and around the village and most of them belonged to the Jatava caste. Even though the share of income from borewell sinking declined from 22.2 per cent in 2006 to 12.4 per cent in 2023, it remained a stable source of income and employment for manual worker households in the village (Das et al. 2024).2 The real income from borewell digging doubled between 2006 and 2023 (Das et al. 2024). In 2023, the average income from borewell digging was Rs 77,000.
In 2006, the agricultural sector was characterised by low productivity and a lack of on-farm diversification. The rice-wheat crop cycle was marked by low yield and low employment generation. Consequently, the non-agricultural sector became a significant source of employment and income. In 2023, the situation remained largely unchanged; crop production still relied heavily on the rice-wheat crop cycle with low returns. Lower peasant and manual worker households leased in land primarily to ensure food security (Johnson and Modak 2025; Munjal 2025; Pandey and Vijay 2024). The unviable nature of agriculture intensified the dependence of the majority of households on non-agricultural occupations.
Harevli
In Harevli, the overall income growth rate was relatively modest at 3.8 per cent between 2006 and 2023 (see Table 3). The agricultural sector grew at 1.1 per cent per annum, while non-agricultural activities grew at 7.7 per cent per annum. Among the agrarian classes, lower peasants experienced the highest income growth from both agricultural and non-agricultural activities. For middle and lower peasant classes, the share of agricultural income in total household incomes was greater than that of non-agricultural income.
Table 3 Growth of agricultural and non-agricultural incomes, by socio-economic class, Harevli, 2006 and 2023 in per cent
| Socio-economic class | Compound annual growth rate (CAGR) of income | ||
| Agriculture | Non-agriculture | Total | |
| Rich peasant | 1.2 | 10.8 | 4.9 |
| Middle peasant | 3.8 | 9 | 5.4 |
| Lower peasant | 5.5 | 16.1 | 8.3 |
| Manual worker | 2 | 4.4 | 3.2 |
| Artisan work and work at traditional caste calling | - | 9.1 | 7.6 |
| Business activity/Self-employment | 6 | 6.2 | 6.2 |
| Salaried person/s | –5.6 | 6.3 | 4.9 |
| Remittances, pensions, small rents | 5 | 9.3 | 9.1 |
| All classes | 1.1 | 7.7 | 3.8 |
Source: PARI survey data, 2006 and 2023.
For landlord/big capitalist farmers and rich peasants, the annual growth rate of income from agriculture was either minuscule or negative in absolute terms between 2006 and 2023. The reason for this unusual statistic is as follows: over the years, they have ceased participating in direct crop production and instead chosen to lease their land to tenants from lower middle and poor peasant classes. In this village, the share of operational landholdings among the upper classes has decreased from 58 per cent in 2006 to 35 per cent in 2023 (see Munjal (2025)). Therefore, the transition from personal cultivation to leasing out land is responsible for the slow income growth in agriculture. However, they continue to receive rent from the land, which contributes to the household income. Furthermore, as previously mentioned, the underestimation of sources and levels of income from other sources has resulted in a negative annual growth rate of household income for the landlord/big capitalist farmers. This is evident from the negative annual growth rate of income from non-agricultural sources for this class between 2006 and 2023.
In the village, the share of income derived from agriculture declined from 61 per cent in 2006 to 40.5 per cent in 2023 (see Table 4). The share of crop income and income from animal resources decreased sharply. The share of income from wage employment remained almost unaltered between 2006 and 2023. Within that, the share of income from agricultural wage employment declined from 10.3 per cent in 2006 to 5.6 per cent in 2023. As Scheduled Castes and Other Backward Classes withdrew from the agricultural wage labour market, the share of income from agricultural wages in total household income for these two caste groups significantly declined between 2006 and 2023 (see Appendix Table 2). However, non-agricultural wage employment witnessed some growth during the inter-survey years, resulting in a significant increase in the proportion of non-agricultural income in the total household income at the village level. For Scheduled Caste and Other Backward Class households, non-agricultural wage income increased remarkably between 2006 and 2023 (see Appendix Table 2).
Table 4 Share of income from different sources, by socio-economic class, Harevli, 2006 and 2023 in per cent
| Socio-economic class | Crop production | Livestock | Agricultural labour | Non-agricultural casual labour | Salary and pension | Business | Remittances | Rent | Others | |||||||||
| 2006 | 2023 | 2006 | 2023 | 2006 | 2023 | 2006 | 2023 | 2006 | 2023 | 2006 | 2023 | 2006 | 2023 | 2006 | 2023 | 2006 | 2023 | |
| Rich peasant | 67.2 | 35.7 | 10.3 | 6.7 | 0 | 0 | 0 | 2.1 | 6.4 | 21.6 | 2.5 | 8.6 | 0 | 0 | 10.5 | 12.4 | 3 | 12.8 |
| Middle peasant | 59.4 | 51.9 | 15.7 | 7.2 | 1.5 | 0.6 | 1.9 | 0.9 | 12.7 | 18.9 | 0 | 4.5 | 4.7 | 2.2 | 2.8 | 7.5 | 1.2 | 6.3 |
| Lower peasant | 8.9 | 35.6 | 18.4 | 12.8 | 59.4 | 7.5 | 8.9 | 14.2 | 1.8 | 3.9 | 1.1 | 4.9 | 0 | 7.1 | 1.4 | 9.2 | 0.1 | 4.6 |
| Manual worker | 0.6 | 6.7 | 13.8 | 4.7 | 42.3 | 35.3 | 31.9 | 46.3 | 3.5 | 2.1 | 0 | 0 | 5.9 | 1.3 | 1.9 | 1.9 | 0.1 | 1.6 |
| Artisan work and work at traditional caste | 0 | 0 | 20.7 | 0 | 0 | 0 | 0 | 100 | 0 | 0 | 0 | 0 | 0 | 0 | 0 | 0 | 79.3 | 0 |
| Business activity/self-employed | 2 | 1.1 | 7.4 | 4.1 | 1.5 | 5.3 | 2.9 | 0.9 | 0.3 | 8.9 | 63 | 65.7 | 22.2 | 0 | 0.7 | 13.6 | 0 | 0.3 |
| Salaried person/s | 16.9 | 0 | 6.4 | 3.8 | 0 | 0 | 0 | 1.8 | 75.3 | 93.1 | 0 | 0 | 0 | 0 | 1.4 | 1.3 | 0 | 0 |
| Remittances/pension/rental incomes | 0 | 1.1 | 7.1 | 2 | 0 | 0.6 | 0 | 2.1 | 4.3 | 6.4 | 0 | 14.3 | 43.7 | 58.5 | 44.4 | 13.6 | 0.6 | 1.4 |
| All classes | 48.9 | 32.7 | 12.1 | 7.8 | 10.3 | 5.6 | 4.3 | 9.1 | 9.3 | 15.3 | 3.5 | 8.7 | 2.5 | 5.2 | 7.1 | 9.1 | 2 | 6.5 |
Source: PARI survey data, 2006 and 2023.
The income composition of the lower peasant class suggests that the share of income derived from agriculture rose substantially, increasing from 27.3 per cent to 48.4 per cent, while income from wage employment experienced a sharp decline – from 68.3 per cent to 21.7 per cent. In 2023, the lower peasant class had leased a significant amount of land, and 41 per cent of the total operated land was leased in by cultivators, compared to only 26 per cent in 2006. The average land ownership of the lower peasant class was 1.1 acres, and they cultivated an average of 3.6 acres of land. The extent of land operated by this class averaged 2.4 acres in 2006. In 2023, due to the increase in extent cultivated, income from crop production had increased. The rise in crop production led to an increase in the use of family labour, especially female family labour, for various farm activities. The use of female family labour in crop production, both in absolute and relative terms, increased between 2006 and 2023. The proportion of female family labour days relative to total family labour days increased from 12.7 per cent in 2006 to 20.7 per cent in 2023.
The sources of non-agricultural income varied across different socio-economic classes. Among the rich and middle peasant classes, the proportion of income derived from salaries and pensions increased significantly over the years. Additionally, the share of income from renting agricultural machinery increased for the rich and middle peasant classes. For the landlord/big capitalist farmer class, the share of rental income from land in total household income nearly tripled, increasing from 7.1 per cent to 21.3 per cent. This is in line with the observed rise in tenancy. The redistribution of operational land through tenancy impacted the composition of income and the labour process of lower peasant households. Nevertheless, the overall sectoral composition of income generation in Harevli did not change significantly over the 17 years, as agriculture continued to contribute around 40 per cent to the total household incomes of the agrarian classes.
Levels of Household Incomes
In Mahatwar, average household income rose by 175 per cent in real terms, rising from Rs 102,170 in 2006 to Rs 280,833 in 2023 (see Table 5). Among the various caste groups, the average household income of Scheduled Castes experienced the highest growth, at 267 per cent. Note that the baseline household income for Scheduled Caste households was low in 2006. Between 2006 and 2023, the expansion of businesses and other self-employment activities was the primary driver of income growth for Scheduled Caste households. In contrast, the income of Other Caste Hindus in 2023 was only 20 per cent higher than that in 2006. The income of Other Backward Class households increased by 186 per cent between 2006 and 2023. The substantial income growth among Scheduled Caste households, coupled with the minimal income growth of Other Caste Hindus, served to narrow the income gap between these two groups. In 2006, the mean annual income of a Caste Hindu household was five times greater than that of a Scheduled Caste household. In 2023, the ratio fell to two. The narrowing of the income gap between these two caste groups can be attributed to two factors: first, the distribution of agricultural income through tenancy, and second, increase in self-employment and wage-based employment, including income from migrants, among Scheduled Caste households.3
Table 5 Number of households and mean annual household income, by caste category, Mahatwar, 2006 and 2023 in per cent and rupees
| Caste category | 2006 | 2023 | Percentage increase from 2006 to 2023 | ||||
| Share of all HHs | Mean annual income* (Rs) | Ratio of all groups to Scheduled Castes | Share of all HHs (%) | Mean annual income (Rs) | Ratio of all groups to Scheduled Castes | ||
| Scheduled Castes | 60 | 70417 | 1 | 61 | 258623 | 1 | 267 |
| Other Backward Castes | 32 | 101627 | 1.4 | 31 | 290836 | 1.1 | 186 |
| Other Hindu Castes | 8 | 353164 | 5 | 7 | 424316 | 1.6 | 20 |
| Scheduled Tribes | - | 0 | 393739 | 1.5 | |||
| All | 100 (156) | 102170 | 1.5 | 100 (221) | 280833 | 1.1 | 175 |
Note: *At 2023 prices; HHs: Households.
Source: PARI survey data, 2006 and 2023.
The class-wise income data indicate that, except for the landlord and big capitalist farmer class, income growth was positive across all classes. For middle peasants and non-agrarian classes, income growth was high, primarily due to earnings from non-agricultural sources. Among all socio-economic classes, salaried individuals received the highest income in 2023, amounting to Rs 903,305 (on average), six times greater than that of manual workers. Additionally, it is evident that, in absolute terms, the income levels of salaried person/s and those engaged in business activities/self-employment were substantially higher than the annual household income of agrarian classes in 2023.
In Harevli, between 2006 and 2023, the mean household income for Scheduled Caste and Muslim households increased by nearly 125 per cent (see Table 7). Both social groups had a low baseline income in 2006. In contrast, the mean household income of Other Caste Hindus rose by 103 per cent during the same period. The income gap between Scheduled Caste and Muslim households and Other Caste Hindu households remained the same over the 17 years. The mean income ratio of Other Caste Hindu to Scheduled Caste households was 3.7 in 2006, which fell insignificantly to 3.4 in 2023.
Table 6 Average household income, by socio-economic class, Mahatwar, 2006 and 2023 in numbers and rupees
| Socio-economic class | 2006 | 2023 | Per cent increase from 2006 to 2023 | ||
| Number of HHs | Mean annual income* (Rs) | Estimated number of HHs | Estimated mean annual income (Rs) | ||
| Landlord/Big farmer | 4 | 613280 | 6 | 312757 | –49 |
| Rich peasant | 8 | 229136 | 12 | 546845 | 139 |
| Middle peasant | 32 | 68870 | 31 | 247155 | 259 |
| Lower peasant | 30 | 50430 | 47 | 213532 | 323 |
| Manual worker | 36 | 51932 | 82 | 143697 | 177 |
| Artisan work and work at traditional caste occupation | 3 | 29269 | - | - | |
| Business activity/self-employed | 23 | 163473 | 12 | 724410 | 343 |
| Salaried person/s | 7 | 191705 | 7 | 903305 | 371 |
| Remittances/pensions/rental income | 13 | 67417 | 24 | 377813 | 460 |
| All classes | 156 | 102170 | 221 | 280833 | 175 |
Note: *At 2023 prices; HHs: Households.
Source: PARI survey data, 2006 and 2023.
Table 7 Number of households and mean annual household income, by caste category, Harevli, 2006 and 2023 in numbers and rupees
| Caste category | 2006 | 2023 | Per cent increase in HH incomes from 2006 to 2023 | ||||
| Number of HHs | Mean annual income* (Rs) | Ratio of all groups to Scheduled Castes | Number of HHs | Mean annual income (Rs) | Ratio of all groups to Scheduled Castes | ||
| Muslims | 13 | 96176 | 1.2 | 9 | 217235 | 1.2 | 126 |
| Scheduled Castes | 40 | 77331 | 1 | 41 | 173860 | 1 | 125 |
| Other Backward Classes | 24 | 154352 | 2 | 43 | 209784 | 1.2 | 36 |
| Other Hindu Castes | 29 | 287398 | 3.7 | 30 | 584779 | 3.4 | 103 |
| All | 106 | 154552 | 2.0 | 123 | 289817 | 1.7 | 88 |
Note: *At 2023 prices; HHs: Households.
Source: PARI survey data, 2006 and 2023.
Among agrarian classes, the annual household income for lower peasant households increased by 287 per cent over the 17-year period (see Table 8). In 2006, the average income of lower peasant households was nearly equivalent to that of manual worker households. However, by 2023, the household income of the lower peasant class had more than doubled compared to that of manual worker households. In this village, 15 per cent of all households belonged to non-agrarian classes. The income levels for non-agrarian classes other than salaried person/s were low compared to the upper segment of agrarian classes.
Table 8 Average household income, by socio-economic class, Harevli, 2006 and 2023 in numbers and rupees
| Socio-economic class | 2006 | 2023 | Per cent increase from 2006 to 2023 | ||
| Number of HHs | Mean HH income* (Rs) | Number of HHs | Mean HH Income (Rs) | ||
| Rich peasant | 23 | 396165 | 11 | 886227 | 124 |
| Middle peasant | 15 | 178190 | 21 | 433202 | 143 |
| Lower peasant | 28 | 59311 | 39 | 229333 | 287 |
| Manual worker | 26 | 59158 | 33 | 100358 | 70 |
| Artisan work and work at traditional caste selling | 2 | 21605 | 1 | 75600 | 250 |
| Business activity/self-employed | 5 | 106142 | 6 | 293285 | 176 |
| Salaried person/s | 3 | 223626 | 2 | 507234 | 127 |
| Remittances/pension/rental incomes | 4 | 38566 | 10 | 169619 | 340 |
| All classes | 106 | 154552 | 123 | 289817 | 88 |
Note: *At 2023 prices; HHs: Households.
Source: PARI survey data, 2006 and 2023.
Income Diversification
In rural India, the majority of households, regardless of their initial economic and social conditions, have diversified sources of income (Bakshi 2017; Modak and Swaminathan 2019). The diversification strategies of rich and poor households differ due to variations in labour and capital endowments (Barrett et al. 2005). In developing countries like India, “mixed households” – those engaged in both farming and non-farming activities – generate approximately 50 per cent of their household income from diverse sources (Reardon et al. 2007). Migration has emerged as a significant element of diversification, particularly for households belonging to the Scheduled Castes and Other Backward Classes. Furthermore, Lanjouw and Shariff (2002) observed that Scheduled Caste individuals had a better opportunity of engaging in non-farm activities that feature low entry barriers.
To measure diversification, we employed Simpson’s Index of Diversity (SID), a widely used measure that captures a household’s diversity in incomes from different sources (Kundu and Das 2021; Dutta and Dhar 2023). The index is calculated as
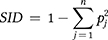
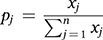
In this formulation, pj represents the share of income from source j, xj denotes the income earned by a household from jth livelihood source, n denotes the total number of distinct income-generating activities. The SID ranges from 0 to 1, where 0 indicates complete specialisation (i.e., income derived from a single source), while values approaching 1 imply a high degree of income diversification.
SID reflects both the number of income sources and the distribution of income across those sources. A household with income heavily concentrated in a single source will have a lower SID than a household whose income is more evenly distributed across multiple sources. Thus, SID captures not only diversification but also the relative balance of earnings, offering insight into the structure and stability of household incomes. Households with fewer income sources may exhibit stability and have limited incentives to diversify, especially if those sources are reliable or high yielding. Less stable income streams tend to result in higher SID values. This distinction underscores how diversification may arise from necessity rather than choice.
Mahatwar
The diversification strategies of various socio-economic classes differed significantly. Generally, those higher up the socio-economic class ladder diversified their sources of income primarily for wealth accumulation. Their diversification was often in complementary activities within the agricultural value chain. Moreover, access to quality education and highly remunerative job markets helped them achieve higher income mobility. In contrast, resource-poor classes, such as manual workers and lower peasants, diversified their income sources to ensure a steady means of consumption. Their diversification strategies frequently involved non-farm wage work. In this village, we observed distinct diversification strategies across socio-economic classes. Between the two survey years, the overall income diversification index increased marginally from 0.447 in 2006 to 0.460 in 2023 (see Table 9). For the landlord/big farmers class, the diversification index declined from 0.634 to 0.364 while for the manual workers class, it rose from 0.390 in 2006 to 0.465 in 2023. A similar pattern was observed among middle peasants. The diversification index for business activities/self-employment class and remittances/pension/rental incomes class remained low during both survey years, indicating that their earnings from fewer but assured sources were sufficiently large, thereby helping them specialise.
Table 9 Simpson’s Index of Diversity, by socio-economic class, Mahatwar, 2006 and 2023
| Socio-economic class | 2006 | 2023 |
| Landlord/Big farmer | 0.634 | 0.364 |
| Rich peasant | 0.595 | 0.509 |
| Middle peasant | 0.555 | 0.549 |
| Lower peasant | 0.503 | 0.529 |
| Manual worker | 0.390 | 0.465 |
| Artisan work and work in traditional caste occupation | 0.389 | - |
| Business activity/self-employed | 0.340 | 0.368 |
| Salaried person/s | 0.250 | 0.516 |
| Remittances/pension/rental incomes | 0.364 | 0.210 |
| Total | 0.447 | 0.460 |
Source: PARI survey data, 2006 and 2023.
Harevli
The income diversification index of all households in Harevli increased from 0.448 in 2006 to 0.517 in 2023 (see Table 10). Among different socio-economic classes, income diversification rose more among lower peasant and manual worker classes than others. In 2023, the lower peasant class earned income from non-agricultural wage work, remittances, and rental income from machinery and agricultural land (in a few cases). Among manual workers, the number of income sources increased between the survey years. In addition to wage employment in the non-agricultural sector, they received incomes from pensions, scholarships, and so on. In 2023, among landlord/big capitalist farmers and rich peasants, the main sources of income were rental income from agricultural land, public and private salaried jobs, and business. The index of income diversification across classes did not change much between 2006 and 2023. In 2006, for the upper section of the agrarian classes, apart from income derived from agricultural land, incomes were received from regular employment, such as government jobs, and none of them were employed in regular salaried jobs in the private sector. In 2023, some members of these classes were in private salaried jobs. For the lower section of the peasantry and manual workers, the probability of obtaining regular salaried jobs was low in 2006 and remained so in 2023.
Table 10 Simpson’s Index of Diversity, by socio-economic class, Harevli, 2006 and 2023
| Socio-economic class | 2006 | 2023 |
| Rich peasant | 0.489 | 0.545 |
| Middle peasant | 0.475 | 0.510 |
| Lower peasant | 0.553 | 0.625 |
| Manual worker | 0.364 | 0.473 |
| Artisan work and work in traditional caste occupation | 0.202 | |
| Business activity/self-employed | 0.342 | 0.308 |
| Salaried person/s | 0.362 | 0.164 |
| Remittances/pension/rental incomes | 0.235 | 0.472 |
| Total | 0.448 | 0.517 |
Source: PARI survey data, 2006 and 2023.
Concluding Remarks
This paper compared the growth and composition of household incomes in Mahatwar and Harevli in Uttar Pradesh, using data collected in 2006 and 2023. Further, it examined changes in levels of household incomes and in income diversification over the 17-year period.
First, Mahatwar experienced a notably high income growth rate of 6.1 per cent per annum between 2006 and 2023, while the agricultural income growth rate remained nearly stagnant. In Harevli, the overall income growth rate was 3.3 per cent per annum during the same period, with minimal growth in agricultural income. The composition of agricultural and non-agricultural incomes varied between the study villages. Dependence on agriculture was more pronounced in Harevli than in Mahatwar. In Harevli, agricultural income accounted for over 40 per cent of household income among peasant classes in 2023. By contrast, only 8.4 per cent of household incomes in Mahatwar came from agriculture.
Secondly, in both villages, the primary drivers of income growth were non-agricultural activities within the village economy and beyond. In Mahatwar, non-agricultural income grew at a rate of 7 per cent per annum, while in Harevli, it grew at a rate of 6 per cent per annum, underscoring the increasing significance of rural economic diversification.
Thirdly, the absolute income levels of the agrarian classes were lower than those of the salaried and business classes in the study villages. For instance, the estimated mean income of a salaried household was six times greater than that of a manual worker household and 3.6 times higher than that of a middle peasant household in Mahatwar. In Harevli, in terms of absolute income levels, the salaried class fared better than the middle to lower sections of the peasantry. The agricultural classes relied on a broader range of livelihood activities, while the salaried and business classes received their income from fewer, more specialised sources.
Lastly, although the overall change in income diversification (measured by Simpson’s Index) was modest, the nature of diversification varied significantly across class lines – expanding among peasants and workers while narrowing among landlords and big capitalist farmers. These findings underscore the increasing heterogeneity of the rural economy and the differentiated pathways through which rural households navigate economic change.
Acknowledgements: The authors thank Jens Lerche, Madhura Swaminathan, and V. K. Ramachandran for their valuable comments and suggestions. We are also grateful to the FAS team, especially Arindam Das, for preparing the data used in this paper.
Notes
1 A comprehensive review of income calculation methods for rural households can be found in Bakshi (2017).

2 Manual workers in Mahatwar were almost all from the Jatava caste.
3 There is also the problem of underestimation of incomes of Other Caste Hindu households.
References
| Bakshi, Aparajita, and Modak, Tapas Singh (2017), “Incomes of Small Farmer Households,” in Swaminathan, Madhura and Baksi, Sandipan (eds.), How Do Small Farmers Fare? Evidence from Village Studies in India, Tulika Books, New Delhi.
| |
| Bardhan, Pranab K. (1984), Land, Labor, and Rural Poverty: Essays in Development Economics, Columbia University Press, New York.
| |
| Barrett, Christopher B., Lee, David R., and McPeak, John G. (2005), “Institutional Arrangements for Rural Poverty Reduction and Resource Conservation,” World Development, vol. 33, no. 2, pp. 193–7.
| |
| Binswanger-Mkhize, Hans P. (2013), “The Stunted Structural Transformation of the Indian Economy: Agriculture, Manufacturing and the Rural Non-Farm Sector,” Economic and Political Weekly, vol. 48, no. 26–27, pp. 5–13.
| |
| Das, Arindam, Dhar, Niladri Sekhar, Munjal, Kunal, and Swaminathan, Madhura (2024), “Patterns of Income Growth in an Eastern Uttar Pradesh Village, 2006–23,” Economic and Political Weekly, vol. 59, no. 43, available at https://www.epw.in/journal/2024/43/review-rural-affairs/patterns-income-growth-eastern-uttar-pradesh.html, viewed on April 16, 2025.
| |
| Deaton, Angus, and Kozel, Valerie (2005), The Great Indian Poverty Debate, Macmillan, New Delhi.
| |
| Deshpande, Ashwini (2011), The Grammar of Caste: Economic Discrimination in Contemporary India, Oxford University Press, New Delhi.
| |
| Dhar, Niladri Sekhar (2025), “Socio-economic Classes in Two Villages in Uttar Pradesh,” Review of Agrarian Studies, vol. 15, no. 2.
| |
| Dhar, Niladri Sekhar, Pandey, Mrityunjay, and Kumar, Awanish (2002), “Identifying Socio-Economic Classes in Two Villages of Bihar,” Review of Agrarian Studies, vol. 12, no. 1, available at https://doi.org/10.25003/RAS.12.01.0005, viewed on May 24, 2025.
| |
| Dutta, Meghna, and Dhar, Niladri Sekhar (2022), “Income Diversification Among Rural Households: Patterns and Determinants in Enhancing Agricultural Productivity and Farmer Incomes in Bihar,” Bhaumik, Sankarshan (ed.), Enhancing Agricultural Productivity and Farmer Incomes in Bihar, Sage Publishing, New Delhi, pp. 283–309.
| |
| Ellis, Frank (2000), “The Determinants of Rural Livelihood Diversification in Developing Countries,” Journal of Agricultural Economics, vol. 51, no. 2, pp. 289–302.
| |
| Foundation for Agrarian Studies (2015), “Calculations of Household Incomes – A Note on Methodology,” available at https://fas.org.in/wp-content/uploads/2021/10/Calculation-of-Household-Incomes-A-Note-on-Methodology.pdf, viewed on May 25, 2025.
| |
| Himanshu (2010), “Towards New Poverty Lines for India,” Economic and Political Weekly, vol. 45, no. 1, pp. 38–48.
| |
| Himanshu, Lanjouw, Peter, Murgai, Rinku, and Stern, Nicholas (2013), “Nonfarm Diversification, Poverty, Economic Mobility, and Income Inequality: A Case Study in Village India,” Agricultural Economics, vol. 44, no. 4–5, pp. 461–73.
| |
| Johnson, Deepak, and Modak, Tapas Singh (2025), “Economics of Farming in Mahatwar, Uttar Pradesh,” Review of Agrarian Studies, vol. 15, no. 2, p. 71–87.
| |
| Kundu, Amit, and Das, Sangita (2021), “Occupational Diversification as Livelihood Strategy Among the Agricultural Labour Households of West Bengal, India,” Management and Labour Studies, vol. 47, no. 1, available at https://doi.org/10.1177/0258042x211026149, viewed on May 20, 2025.
| |
| Lanjouw, Peter, and Shariff, Abusaleh (2002), “Rural Non-Farm Employment in India: Access, Income, and Poverty Impact,” Working paper no. 81, National Council for Applied Economic Research, pp. 1–63.
| |
| Lanjouw, Peter, and Shariff, Abusaleh (2004), “Rural Non-Farm Employment in India: Access, Incomes and Poverty Impact,” Economic and Political Weekly, vol. 39, no. 40, pp. 4429–46.
| |
| Modak, Tapas Singh, and Swaminathan, Madhura (2019), “Income Levels and Variations in Three Villages of Tripura,” in Swaminathan, Madhura, and Basu, Ranjini (eds.), Socio-economic Surveys of Three Villages in Tripura: A Study of Agrarian Relations, Tulika Books, New Delhi, pp. 225–57.
| |
| Modak, Tapas Singh, and Swaminathan, Madhura (2023), “Household Incomes,” in Swaminathan, Madhura, Surjit, V., and Ramachandran, V. K. (eds.), Economic Change in the Lower Cauvery Delta: A Study of Palakurichi and Venmani, pp. 259–90.
| |
| Munjal, Kunal (2025), “Cereal Production in the Sugarcane Belt: Commercialisation and Smallholder Tenants in a Western UP Village,” Review of Agrarian Studies, vol. 15, no. 2, p. 88–110.
| |
| Pandey, Mrityunjay, and Vijay, R. (2024), “Analysing Livelihood Strategies of Landless Manual Labour Households in Rural Bihar: A Study of a North Bihar Village,” The Indian Journal of Labour Economics, vol. 67, no. 2, pp. 443–63.
| |
| Ramachandran, V. K. (1990), Wage Labour and Unfreedom in Agriculture: An Indian Case Study, Oxford, Clarendon Press.
| |
| Ramachandran, V. K., Rawal, Vikas, and Swaminathan, Madhura (eds.) (2008), Socio-Economic Surveys of Three Villages in Andhra Pradesh: A Study of Agrarian Relations, Tulika Books.
| |
| Rawal, Vikas, Swaminathan, Madhura, and Dhar, Niladri (2008), “On Diversification of Rural Incomes: A View from Three Villages of Andhra Pradesh,” Indian Journal of Labour Economics, vol. 51, no. 2, pp. 229–48.
| |
| Reardon, Thomas, Stamoulis, Kostas, and Pingali, Prabhu (2007), “Rural Nonfarm Employment in Developing Countries in an Era of Globalization,” Agricultural Economics, vol. 37, pp. 173–83.
| |
| Srivastava, Ravi, and Sasikumar, S. K. (2003), “An Overview of Migration in India, Its Impacts and Key Issues,” Regional Conference on Migration, Development and Pro-Poor Policy Choices in Asia, Dhaka, Eldis Document Store.
|
Appendix
Appendix Table 1 Share of income from different sources, by caste, Mahatwar, 2006 and 2023 in per cent
| Caste | Crop production | Livestock | Agricultural labour | Non-agricultural casual labour | Salary and pension | Business | Remittances | Rent | Others | |||||||||
| 2006 | 2023 | 2006 | 2023 | 2006 | 2023 | 2006 | 2023 | 2006 | 2023 | 2006 | 2023 | 2006 | 2023 | 2006 | 2023 | 2006 | 2023 | |
| Scheduled Castes | 3.6 | 1.5 | 7.9 | 3.6 | 3.5 | 0.6 | 13.3 | 9.1 | 20.3 | 22.7 | 11.9 | 32.4 | 6.6 | 16.6 | 0 | 0.1 | 32.9 | 13.5 |
| Other Backward Classes | 13.8 | 7.1 | 13.2 | 5.2 | 0.1 | 0 | 8.7 | 8.3 | 9.3 | 26.4 | 42.4 | 18.2 | 8 | 28.9 | 1.4 | 4.2 | 2.9 | 1.7 |
| Other Caste Hindus | 20.1 | 11 | 11.9 | 4 | 0 | 0 | 0.2 | 0 | 15.7 | 57 | 24.5 | 12.5 | 3.6 | 8.5 | 5.4 | 5.1 | 18.6 | 1.8 |
| Scheduled Tribes | 0 | –0.9 | 0 | 4.9 | 0 | 0 | 0 | 0 | 0 | 94.5 | 0 | 0 | 0 | 0 | 0 | 0 | 0 | 1.5 |
| All | 11.3 | 4.3 | 10.7 | 4.1 | 1.5 | 0.3 | 8.4 | 7.8 | 15.6 | 28 | 25 | 25.5 | 6.3 | 19.6 | 1.9 | 1.9 | 19.5 | 8.4 |
Source: PARI survey data, 2006 and 2023.
Appendix Table 2 Share of income from different sources, by social groups, Harevli, 2006 and 2023 in per cent
| Caste | Crop production | Livestock | Agricultural labour | Non-agricultural casual labour | Salary and pension | Business | Remittances | Rent | Others | |||||||||
| 2006 | 2023 | 2006 | 2023 | 2006 | 2023 | 2006 | 2023 | 2006 | 2023 | 2006 | 2023 | 2006 | 2023 | 2006 | 2023 | 2006 | 2023 | |
| Muslims | 27.3 | 10.6 | 6.7 | 8.5 | 8 | 6.5 | 29.3 | 2.6 | 9.5 | 1.8 | 4.8 | 17.5 | 9.2 | 45.1 | 5.1 | 1.7 | 0 | 5.7 |
| Scheduled Castes | 27.1 | 29.1 | 12.1 | 11.7 | 32.8 | 12.9 | 6.4 | 17.7 | 12.1 | 16.8 | 2.9 | 0.4 | 4.5 | 9.1 | 1.8 | 0.8 | 0.2 | 1.4 |
| Other Backward Classes | 47.5 | 28.2 | 13.8 | 6.6 | 15.5 | 10.6 | 2.4 | 18.3 | 12 | 9.7 | 0.4 | 7.9 | 0 | 1.2 | 6.8 | 11.6 | 1.6 | 5.9 |
| Other Hindu Castes | 60.9 | 38.9 | 12.1 | 6.7 | 0 | 0 | 0.6 | 1.6 | 7 | 19.1 | 4.9 | 11.4 | 1.8 | 1.3 | 9.6 | 12 | 3.1 | 9 |
| All | 48.9 | 32.7 | 12.1 | 7.8 | 10.3 | 5.6 | 4.3 | 9.1 | 9.3 | 15.3 | 3.5 | 8.7 | 2.5 | 5.2 | 7.1 | 9.1 | 2 | 6.5 |
Source: PARI survey data, 2006 and 2023.
Date of submission of manuscript: April 18, 2025
Date of acceptance for publication: September 1, 2025