

ARCHIVE
Vol. 1, No. 1
JANUARY-JUNE, 2011
Research Articles
Research Notes and Statistics
Symposium
Book Reviews
A Note on
Recent Trends in Wage Rates
in Rural
Yoshifumi Usami
Research Fellow, Center for Evolving Humanities, The University of Tokyo. yoshiusami@gmail.com.
Introduction
This is a short note on recent trends in wage rates
for agricultural and rural labour, as reported by the Labour
Bureau, Government of India, in Wage
Rates in Rural India (WRRI). There are two data sources relating to agricultural and
non-agricultural wages in rural India. One is the well-known Agricultural Wages in India (AWI), collected and reported by the
Directorate of Economics and Statistics, Ministry of Agriculture; and the other
is the one that is taken up here for study. AWI
has a long history, and has been widely used for analysing long-term changes in
the wage rates of agricultural and rural labour. However, since these data are
collected through a local-level administrative institution, the AWI has several limitations, which pose
substantial difficulties to users.1 In addition, the AWI is presently available for up to 2004–05 only, and it is
therefore not possible to look at recent trends in agricultural wages, and to
measure any impact of macroeconomic growth or of schemes under the widely
propagated NREGA (National Rural Employment Guarantee Act).
WRRI data, on the other hand, have been
collected since 1986–87, although they were not published for some time, and
the Labour Bureau took up the compilation of wage rate statistics from the
agricultural year 1995–96. One of the merits of the WRRI data is that they are available for up to 2008–09, and hence
are more appropriate to study recent trends. The purpose of this note is to
review the WRRI data, and to find the
salient features of recent trends in agricultural and non-agricultural wage
rates.
WRRI:
Methodological Problems
In accordance with the recommendation made by the
Technical Working Group on Rural Retail Prices set up by the National Sample
Survey Organization (NSSO), the wage rates of 18 agricultural and
non-agricultural occupations have been collected every month, from a fixed set
of 600 sample villages spread over 20 States, since 1986–87. The wage rate data
are collected by the NSSO along with the rural retail price data in schedule
No. 3.01 (R).
The primary data sources are village functionaries
like the Panchayat Secretary, Progress Assistant, Patwari, and other village or block-level officials. The
data on normal working hours and on wage rates for the reported working hours
are collected sex-wise for each of the 18 selected occupations. The wage rates
thus collected are then normalized for an eight-hour working day. In the next
stage, the simple arithmetic average of these normalized daily wage rates is
worked out for each State. The daily wage rates at the all-India level until
1999–2000 were derived by taking a simple average of State figures, but after
2000–01, by taking a simple average of all the sample villages. The all-India
figures before and after 2000 are therefore not compatible.
Compared with the AWI
data, the collection and compilation of the WRRI
data are regarded as methodologically more reliable with
respect to sampling method, in the fact that data are collected by trained NSS
investigators and in the estimation of average wage
rates. Nevertheless, there is a problem with the WRRI data that it shares with the AWI data, namely that the wage rates are not always reported from
all the sample villages. This is for the following reasons:
|
(i) |
the
activity connected with the occupation was not undertaken in the village; |
|
(ii) |
the
activity was out of season in the village; or |
|
(iii) |
the
particular category of workers (i.e. men/women/children) was not engaged in
that occupation. |
This fact, that the number of sample villages may
vary, causes a serious problem, particularly in a State where wage rates differ
greatly across sample villages due to reasons such as closeness to urban
centres. The State’s average wage rate falls when no wage rates are reported
from some of the high wage rate villages, and vice-versa. Fluctuation of the
monthly wage rate is therefore not always real, but because of variations in
the number of reporting sample villages. In an attempt to avoid this problem,
State-wise average daily wage rates are not reported in the WRRI if the reporting number is less
than five. However, this does not solve the problem. Irregular fluctuations can
be observed in the movement of monthly wage rates in any occupation,
particularly in small States like Himachal Pradesh
and Jammu & Kashmir.
Varieties of crops are grown depending on the agro-climatic and economic conditions of a region.
Agricultural operations are seasonal. An operation like sowing or harvesting,
for example, is performed for different crops in different seasons and in
different regions, and, as a result, the mode and amount of payment may differ
from one crop to the other. Nevertheless, it is common for wage rates to be
reported throughout the year even if it is unlikely that a particular operation
for a particular crop is performed every month. It is therefore plausible that
seasonal fluctuations in wage rates, where they occur, reflect operations for
different crops.
In addition, there are several outliers that are
likely to be errors at some stage in the data collection or in the data entry.
In order to avoid (not solve) these problems, we took
annual averages for the agricultural year (July to June) instead of monthly
data. We worked out the arithmetic means only for those years for which data
were available for four months or more. This was on the assumption that the
average wage rate of certain operations in a particular State indicates
operations for a set of crops or a crop mix in the State.
There is another problem that enters here. The
demarcation of the agricultural year corresponds mainly with harvesting.
Operations like ploughing, sowing, and transplanting of the kharif
crop, however, are usually performed in the months of May–August. Thus, if we
adopt the average based on agricultural year for these operations, it would
reflect the wage rate for kharif crops of the
succeeding year. Therefore we took the 12-month period from May to April to
work out the average wage rates of ploughing, sowing, and transplanting.
In order to cover the major operations in farming and
other important occupations in rural areas, and considering data availability,
the wage rates of five agricultural operations, i.e. ploughing (male), sowing
(male), transplanting (male and female), weeding (female), and harvesting (male
and female), and of four rural labour occupations, i.e. carpenter (male),
blacksmith (male), mason (male), and unskilled labour (male and female), are
taken up for this study. Looking at the wage rates for various occupations
allows us to examine the relationships among them. To compute real wage rates,
the nominal wage rates are deflated by the consumer price index for
agricultural labourers (CPIAL) and the consumer price index for rural labourers
(CPIRL) (1986–87 = 100).2
Levels and Growth of Real Wages
for Agricultural and Rural Labourers
Table 1 indicates the State-wise
real wage rates for major occupations from 1998–99 to 2008–09 in rural
Table 1 State–wise real wage rates for major occupations in rural India
|
(A) Ploughing (Male) |
|||||||||||
|
|
1998–99 |
1999–2000 |
2000–01 |
2001–02 |
2002–03 |
2003–04 |
2004–05 |
2005–06 |
2006–07 |
2007–08 |
2008–09 |
|
Andhra Pradesh |
17.30 |
16.49 |
17.31 |
17.76 |
18.22 |
17.29 |
16.86 |
18.09 |
18.79 |
20.50 |
22.75 |
|
Assam |
20.32 |
20.18 |
20.25 |
20.91 |
19.60 |
20.21 |
19.56 |
18.78 |
18.71 |
19.65 |
18.96 |
|
Bihar |
14.48 |
14.89 |
16.77 |
17.99 |
18.55 |
18.67 |
18.54 |
18.33 |
18.31 |
18.62 |
18.99 |
|
Gujarat |
17.76 |
17.78 |
18.70 |
20.11 |
20.08 |
20.26 |
21.10 |
20.78 |
20.02 |
20.49 |
21.35 |
|
Haryana |
22.40 |
24.87 |
26.33 |
24.75 |
25.37 |
24.73 |
25.15 |
24.57 |
24.90 |
25.34 |
26.30 |
|
Himachal Pradesh |
31.15 |
31.45 |
32.76 |
34.28 |
33.70 |
36.91 |
39.53 |
37.69 |
38.98 |
44.41 |
48.16 |
|
Jammu & Kashmir |
29.15 |
28.68 |
33.96 |
35.47 |
35.50 |
35.11 |
34.94 |
34.55 |
32.38 |
31.29 |
29.91 |
|
Karnataka |
15.10 |
15.45 |
17.75 |
18.65 |
18.02 |
17.46 |
16.85 |
17.80 |
17.48 |
17.71 |
18.80 |
|
Kerala |
58.94 |
57.11 |
59.83 |
70.32 |
74.76 |
71.15 |
61.03 |
60.80 |
61.24 |
68.18 |
64.07 |
|
Madhya Pradesh |
14.85 |
14.60 |
14.38 |
15.44 |
15.59 |
15.81 |
15.63 |
14.82 |
14.15 |
14.89 |
15.52 |
|
Maharashtra |
16.83 |
17.70 |
19.49 |
19.43 |
19.46 |
18.88 |
17.80 |
17.68 |
18.17 |
18.95 |
19.46 |
|
Manipur |
18.35 |
18.55 |
20.40 |
20.46 |
20.25 |
22.22 |
22.87 |
21.93 |
21.16 |
24.68 |
26.96 |
|
Meghalaya |
17.54 |
17.05 |
16.74 |
16.56 |
19.74 |
22.59 |
22.52 |
22.08 |
20.91 |
20.11 |
18.61 |
|
Orissa |
14.09 |
12.50 |
15.34 |
17.81 |
18.41 |
17.18 |
17.81 |
17.71 |
16.66 |
15.89 |
16.39 |
|
Punjab |
21.33 |
21.44 |
na |
na |
na |
na |
na |
na |
na |
na |
na |
|
Rajasthan |
25.37 |
24.43 |
26.57 |
28.78 |
27.54 |
25.70 |
26.66 |
23.52 |
22.29 |
25.99 |
26.07 |
|
Tamil Nadu |
30.24 |
34.81 |
37.06 |
37.62 |
34.81 |
33.49 |
32.47 |
32.00 |
32.41 |
34.57 |
32.73 |
|
Tripura |
14.81 |
16.09 |
16.55 |
18.31 |
18.49 |
22.88 |
20.74 |
22.85 |
23.76 |
22.29 |
23.70 |
|
Uttar Pradesh |
15.79 |
16.87 |
18.44 |
18.02 |
18.16 |
18.11 |
17.96 |
17.40 |
16.58 |
17.02 |
18.34 |
|
West Bengal |
20.03 |
23.00 |
23.92 |
23.73 |
25.44 |
26.26 |
24.92 |
27.22 |
27.76 |
27.49 |
26.48 |
|
India |
21.90 |
22.35 |
21.72 |
22.26 |
22.37 |
22.18 |
21.25 |
21.35 |
21.00 |
21.82 |
22.06 |
|
(B) Sowing (Male) | |||||||||||
|
|
1998–99 |
1999–2000 |
2000–01 |
2001–02 |
2002–03 |
2003–04 |
2004–05 |
2005–06 |
2006–07 |
2007–08 |
2008–09 |
|
Andhra Pradesh |
13.53 |
12.88 |
14.18 |
14.46 |
14.78 |
14.57 |
14.98 |
15.15 |
16.27 |
18.12 |
18.83 |
|
Assam |
14.61 |
15.09 |
16.63 |
17.07 |
16.83 |
18.46 |
18.32 |
18.67 |
18.62 |
19.48 |
19.04 |
|
Bihar |
14.42 |
14.65 |
16.39 |
17.19 |
18.06 |
17.86 |
17.53 |
17.24 |
16.55 |
16.36 |
16.50 |
|
Gujarat |
16.95 |
17.03 |
17.75 |
18.96 |
18.97 |
19.17 |
19.61 |
18.72 |
18.48 |
18.66 |
18.94 |
|
Haryana |
21.26 |
24.41 |
25.03 |
25.04 |
25.30 |
23.72 |
24.08 |
25.16 |
24.67 |
24.73 |
26.29 |
|
Himachal Pradesh |
27.08 |
30.60 |
35.34 |
34.00 |
33.38 |
33.95 |
na |
na |
na |
36.44 |
37.52 |
|
Jammu & Kashmir |
24.73 |
24.25 |
27.51 |
31.34 |
32.05 |
34.02 |
34.53 |
33.14 |
28.28 |
30.76 |
29.79 |
|
Karnataka |
15.06 |
15.39 |
16.85 |
17.30 |
16.51 |
15.88 |
15.39 |
14.56 |
16.12 |
16.03 |
16.44 |
|
Kerala |
43.89 |
48.39 |
52.70 |
55.15 |
53.31 |
51.26 |
53.04 |
51.68 |
54.36 |
53.08 |
52.60 |
|
Madhya Pradesh |
13.86 |
14.68 |
14.32 |
14.80 |
14.86 |
15.51 |
15.18 |
13.99 |
13.20 |
13.25 |
13.66 |
|
Maharashtra |
15.87 |
16.08 |
17.56 |
18.29 |
18.19 |
18.05 |
16.98 |
16.60 |
16.86 |
17.37 |
18.13 |
|
Manipur |
17.60 |
16.66 |
19.30 |
18.04 |
16.72 |
18.74 |
19.32 |
18.52 |
17.97 |
18.18 |
19.39 |
|
Meghalaya |
16.29 |
15.46 |
16.40 |
16.27 |
18.17 |
20.34 |
20.76 |
20.31 |
19.65 |
19.03 |
18.02 |
|
Orissa |
13.88 |
12.03 |
13.71 |
15.50 |
16.96 |
16.35 |
16.40 |
16.98 |
15.80 |
14.40 |
15.80 |
|
Punjab |
22.13 |
22.23 |
23.10 |
24.97 |
na |
25.19 |
24.16 |
22.43 |
21.50 |
22.35 |
23.01 |
|
Rajasthan |
24.57 |
24.00 |
27.20 |
30.80 |
29.05 |
25.47 |
25.80 |
24.09 |
20.54 |
22.03 |
21.65 |
|
Tamil Nadu |
21.61 |
21.90 |
22.48 |
23.51 |
21.48 |
20.99 |
21.73 |
21.17 |
22.03 |
22.95 |
22.52 |
|
Tripura |
14.81 |
16.09 |
16.42 |
18.31 |
18.43 |
21.08 |
20.74 |
22.85 |
23.76 |
22.27 |
23.70 |
|
Uttar Pradesh |
15.47 |
16.37 |
17.98 |
17.79 |
17.64 |
17.63 |
17.41 |
16.60 |
15.76 |
16.71 |
17.80 |
|
West Bengal |
14.17 |
15.43 |
16.87 |
17.09 |
17.64 |
16.81 |
16.62 |
17.85 |
18.57 |
18.29 |
18.19 |
|
India |
19.22 |
19.84 |
19.52 |
19.87 |
19.58 |
19.63 |
19.40 |
19.17 |
18.95 |
18.93 |
19.32 |
|
(C) Transplanting
(Male) |
|||||||||||
|
|
1998–99 |
1999–2000 |
2000–01 |
2001–02 |
2002–03 |
2003–04 |
2004–05 |
2005–06 |
2006–07 |
2007–08 |
2008–09 |
|
Andhra Pradesh |
14.42 |
12.85 |
13.62 |
15.81 |
16.07 |
15.01 |
15.09 |
14.87 |
16.13 |
16.43 |
20.88 |
|
Assam |
15.18 |
16.39 |
16.94 |
17.79 |
18.04 |
18.76 |
18.44 |
18.65 |
18.72 |
19.13 |
18.19 |
|
Bihar |
13.47 |
12.72 |
14.83 |
15.33 |
16.86 |
16.71 |
16.53 |
15.81 |
14.63 |
14.37 |
15.03 |
|
Gujarat |
14.08 |
13.71 |
13.38 |
15.19 |
15.15 |
15.07 |
15.11 |
14.34 |
14.03 |
14.24 |
14.20 |
|
Haryana |
20.00 |
24.52 |
26.10 |
24.88 |
25.65 |
23.82 |
24.00 |
25.26 |
24.72 |
24.47 |
25.89 |
|
Himachal Pradesh |
27.03 |
28.17 |
na |
na |
na |
na |
na |
na |
na |
na |
na |
|
Jammu & Kashmir |
22.43 |
25.90 |
na |
na |
na |
32.68 |
na |
30.72 |
29.45 |
28.27 |
28.22 |
|
Karnataka |
14.28 |
14.83 |
16.01 |
16.95 |
16.25 |
15.73 |
15.76 |
16.53 |
16.15 |
15.99 |
15.13 |
|
Kerala |
29.82 |
na |
na |
na |
na |
na |
na |
na |
na |
na |
na |
|
Madhya Pradesh |
14.32 |
14.92 |
na |
11.35 |
11.73 |
14.65 |
14.94 |
14.97 |
na |
12.73 |
13.32 |
|
Maharashtra |
16.13 |
16.36 |
20.11 |
20.40 |
19.55 |
19.80 |
19.14 |
18.08 |
17.64 |
17.06 |
16.32 |
|
Manipur |
16.97 |
17.97 |
21.31 |
na |
19.69 |
19.26 |
19.32 |
18.52 |
17.97 |
18.18 |
19.35 |
|
Meghalaya |
16.60 |
15.88 |
15.78 |
16.34 |
19.61 |
22.82 |
23.42 |
na |
20.02 |
na |
18.61 |
|
Orissa |
13.62 |
12.68 |
13.97 |
14.00 |
15.58 |
16.27 |
16.76 |
17.18 |
15.90 |
15.19 |
16.31 |
|
Punjab |
22.13 |
23.41 |
23.87 |
24.06 |
25.20 |
25.43 |
24.94 |
23.08 |
22.64 |
20.98 |
24.04 |
|
Rajasthan |
na |
na |
na |
na |
na |
na |
na |
na |
na |
na |
na |
|
Tamil Nadu |
18.40 |
19.30 |
22.00 |
21.88 |
20.45 |
19.16 |
19.53 |
20.47 |
20.23 |
20.55 |
21.69 |
|
Tripura |
14.81 |
16.09 |
16.42 |
18.31 |
18.43 |
22.09 |
20.74 |
22.87 |
23.76 |
22.27 |
23.70 |
|
Uttar Pradesh |
15.04 |
15.92 |
16.78 |
17.66 |
16.91 |
16.59 |
16.55 |
16.27 |
15.36 |
15.99 |
16.21 |
|
West Bengal |
13.72 |
15.23 |
16.95 |
17.15 |
17.54 |
16.81 |
16.77 |
17.97 |
19.07 |
18.89 |
18.95 |
|
India |
17.44 |
17.79 |
17.09 |
17.63 |
17.90 |
17.95 |
18.16 |
18.30 |
17.96 |
17.79 |
17.84 |
|
(D) Transplanting
(Female) |
|||||||||||
|
|
1998–99 |
1999–2000 |
2000–01 |
2001–02 |
2002–03 |
2003–04 |
2004–05 |
2005–06 |
2006–07 |
2007–08 |
2008–09 |
|
Andhra Pradesh |
10.20 |
10.45 |
10.64 |
10.92 |
10.20 |
9.75 |
10.15 |
10.44 |
11.05 |
12.16 |
15.26 |
|
Assam |
13.84 |
15.38 |
14.74 |
15.20 |
15.54 |
14.59 |
15.21 |
15.72 |
15.83 |
15.77 |
15.40 |
|
Bihar |
12.20 |
11.24 |
13.71 |
14.34 |
15.54 |
15.42 |
15.60 |
14.96 |
13.75 |
13.40 |
13.63 |
|
Gujarat |
13.23 |
13.21 |
12.59 |
14.82 |
14.53 |
14.69 |
14.71 |
14.05 |
13.64 |
13.54 |
13.77 |
|
Haryana |
13.04 |
19.31 |
na |
na |
25.68 |
na |
21.17 |
23.17 |
23.81 |
23.00 |
25.07 |
|
Himachal Pradesh |
24.91 |
27.60 |
na |
na |
na |
na |
na |
na |
na |
na |
na |
|
Jammu & Kashmir |
na |
na |
na |
na |
na |
na |
na |
na |
na |
na |
na |
|
Karnataka |
11.24 |
11.38 |
12.50 |
13.12 |
12.40 |
11.69 |
12.00 |
12.35 |
11.90 |
12.09 |
12.31 |
|
Kerala |
25.21 |
28.91 |
29.24 |
30.36 |
30.20 |
29.10 |
28.96 |
29.49 |
29.33 |
29.36 |
29.36 |
|
Madhya Pradesh |
13.53 |
13.46 |
na |
10.25 |
na |
na |
na |
13.06 |
na |
11.09 |
12.00 |
|
Maharashtra |
13.74 |
12.10 |
13.53 |
13.84 |
13.44 |
13.53 |
12.49 |
12.30 |
12.44 |
11.59 |
10.84 |
|
Manipur |
15.51 |
15.95 |
na |
na |
16.34 |
17.63 |
na |
17.15 |
na |
16.25 |
17.41 |
|
Meghalaya |
13.01 |
11.83 |
11.11 |
10.88 |
13.16 |
15.03 |
15.42 |
14.07 |
14.46 |
14.15 |
12.29 |
|
Orissa |
11.90 |
10.76 |
11.76 |
11.32 |
12.69 |
13.69 |
14.10 |
14.87 |
12.73 |
10.81 |
12.42 |
|
Punjab |
16.87 |
18.14 |
na |
na |
na |
na |
na |
na |
na |
na |
na |
|
Rajasthan |
na |
na |
na |
na |
na |
na |
na |
na |
na |
na |
na |
|
Tamil Nadu |
12.19 |
12.84 |
13.16 |
12.36 |
11.50 |
10.94 |
11.61 |
12.01 |
12.53 |
13.12 |
14.02 |
|
Tripura |
11.47 |
13.54 |
14.48 |
na |
na |
na |
na |
na |
na |
na |
na |
|
Uttar Pradesh |
12.82 |
13.95 |
14.58 |
15.06 |
13.75 |
14.77 |
14.79 |
13.36 |
12.95 |
14.38 |
14.83 |
|
West Bengal |
12.40 |
13.66 |
15.29 |
15.44 |
16.05 |
15.68 |
15.43 |
16.64 |
17.06 |
16.76 |
16.49 |
|
India |
14.36 |
15.45 |
14.90 |
14.95 |
15.04 |
14.65 |
14.89 |
15.04 |
14.64 |
14.81 |
15.25 |
|
(E) Weeding (Female) |
|||||||||||
|
|
1998–99 |
1999–2000 |
2000–01 |
2001–02 |
2002–03 |
2003–04 |
2004–05 |
2005–06 |
2006–07 |
2007–08 |
2008–09 |
|
Andhra Pradesh |
8.53 |
9.37 |
9.98 |
9.48 |
9.24 |
9.44 |
9.75 |
9.94 |
10.84 |
12.20 |
15.06 |
|
Assam |
15.27 |
17.00 |
na |
na |
na |
16.23 |
16.63 |
16.18 |
16.58 |
16.13 |
16.19 |
|
Bihar |
10.86 |
10.99 |
12.32 |
13.19 |
14.37 |
14.29 |
13.09 |
13.15 |
12.05 |
12.08 |
13.07 |
|
Gujarat |
14.72 |
14.62 |
14.93 |
16.16 |
15.41 |
15.14 |
15.67 |
15.33 |
14.51 |
15.11 |
15.69 |
|
Haryana |
19.61 |
20.80 |
21.06 |
23.62 |
22.96 |
22.09 |
23.14 |
na |
na |
na |
24.51 |
|
Himachal Pradesh |
25.71 |
26.72 |
na |
na |
na |
na |
na |
na |
na |
na |
na |
|
Jammu & Kashmir |
na |
na |
na |
na |
na |
na |
na |
na |
na |
na |
na |
|
Karnataka |
10.08 |
10.59 |
11.49 |
11.27 |
11.25 |
10.62 |
10.75 |
10.92 |
10.63 |
10.88 |
10.85 |
|
Kerala |
25.70 |
30.81 |
31.53 |
32.55 |
30.88 |
29.21 |
29.06 |
29.47 |
29.33 |
29.52 |
30.58 |
|
Madhya Pradesh |
11.05 |
11.21 |
11.19 |
11.77 |
11.56 |
11.50 |
11.19 |
10.72 |
10.42 |
10.34 |
10.50 |
|
Maharashtra |
10.64 |
9.70 |
10.86 |
10.80 |
10.55 |
10.15 |
9.51 |
9.81 |
9.96 |
10.21 |
10.02 |
|
Manipur |
13.82 |
12.82 |
na |
na |
15.00 |
17.59 |
17.74 |
16.77 |
16.32 |
16.33 |
17.44 |
|
Meghalaya |
12.73 |
11.78 |
11.25 |
11.56 |
13.12 |
14.65 |
14.89 |
14.70 |
14.15 |
13.08 |
12.57 |
|
Orissa |
11.22 |
10.59 |
11.86 |
11.60 |
15.01 |
12.52 |
14.58 |
12.96 |
14.20 |
na |
12.19 |
|
Punjab |
18.72 |
20.15 |
na |
na |
na |
na |
na |
na |
na |
na |
na |
|
Rajasthan |
17.13 |
17.70 |
20.33 |
20.05 |
13.69 |
15.03 |
15.22 |
15.62 |
15.31 |
15.18 |
18.46 |
|
Tamil Nadu |
10.98 |
12.24 |
12.20 |
11.96 |
11.18 |
11.37 |
11.62 |
12.36 |
12.78 |
13.00 |
14.03 |
|
Tripura |
11.61 |
14.26 |
na |
na |
na |
na |
na |
na |
na |
na |
na |
|
Uttar Pradesh |
11.91 |
13.26 |
15.08 |
14.26 |
14.76 |
15.33 |
14.04 |
13.82 |
13.58 |
14.39 |
15.11 |
|
West Bengal |
12.69 |
13.78 |
14.99 |
15.17 |
15.69 |
15.39 |
15.31 |
15.89 |
16.20 |
16.34 |
16.27 |
|
All India |
14.40 |
15.19 |
13.96 |
13.94 |
13.90 |
13.81 |
13.66 |
13.68 |
13.61 |
13.97 |
14.72 |
|
(F) Harvesting (Male) |
|||||||||||
|
|
1998–99 |
1999–2000 |
2000–01 |
2001–02 |
2002–03 |
2003–04 |
2004–05 |
2005–06 |
2006–07 |
2007–08 |
2008–09 |
|
Andhra Pradesh |
14.26 |
14.07 |
14.24 |
14.45 |
14.15 |
14.24 |
14.59 |
15.64 |
16.12 |
17.76 |
20.67 |
|
Assam |
16.05 |
15.79 |
16.51 |
17.30 |
17.10 |
19.24 |
18.67 |
18.12 |
19.24 |
18.99 |
18.39 |
|
Bihar |
12.75 |
13.18 |
15.30 |
15.87 |
17.76 |
17.63 |
17.31 |
16.74 |
15.48 |
15.07 |
15.69 |
|
Gujarat |
15.95 |
15.42 |
15.96 |
16.41 |
16.52 |
16.22 |
16.36 |
16.01 |
15.63 |
16.06 |
15.48 |
|
Haryana |
22.79 |
25.67 |
26.73 |
26.95 |
27.73 |
26.96 |
27.21 |
27.48 |
26.25 |
26.32 |
27.84 |
|
Himachal Pradesh |
27.29 |
27.40 |
na |
na |
na |
32.81 |
na |
32.94 |
31.14 |
36.20 |
36.58 |
|
Jammu & Kashmir |
26.46 |
26.03 |
29.93 |
32.53 |
31.91 |
33.16 |
31.90 |
31.70 |
29.16 |
29.29 |
30.26 |
|
Karnataka |
14.00 |
14.53 |
16.16 |
16.71 |
15.88 |
15.31 |
15.76 |
15.82 |
15.42 |
15.85 |
16.97 |
|
Kerala |
36.89 |
36.56 |
na |
na |
na |
na |
na |
na |
na |
33.58 |
33.84 |
|
Madhya Pradesh |
12.79 |
13.28 |
13.81 |
14.51 |
14.06 |
14.15 |
14.32 |
13.63 |
12.56 |
13.17 |
13.48 |
|
Maharashtra |
14.36 |
15.38 |
17.32 |
17.69 |
17.88 |
17.17 |
16.64 |
16.17 |
16.73 |
17.35 |
17.62 |
|
Manipur |
17.22 |
17.14 |
na |
na |
17.44 |
19.70 |
19.54 |
18.46 |
17.97 |
18.62 |
19.61 |
|
Meghalaya |
16.98 |
15.79 |
na |
na |
18.76 |
24.22 |
21.51 |
21.17 |
21.45 |
20.24 |
na |
|
Orissa |
14.05 |
12.26 |
13.96 |
14.09 |
16.13 |
15.46 |
16.01 |
16.48 |
14.16 |
14.15 |
16.77 |
|
Punjab |
23.20 |
23.08 |
23.88 |
25.05 |
25.81 |
25.42 |
25.45 |
24.05 |
24.40 |
23.17 |
25.06 |
|
Rajasthan |
22.18 |
21.04 |
25.04 |
25.05 |
19.43 |
20.49 |
19.13 |
19.79 |
17.48 |
19.06 |
22.83 |
|
Tamil Nadu |
18.47 |
19.96 |
22.11 |
21.60 |
19.11 |
19.17 |
19.85 |
20.33 |
20.43 |
21.29 |
22.99 |
|
Tripura |
14.90 |
16.01 |
16.68 |
18.51 |
18.46 |
22.82 |
21.02 |
23.27 |
23.47 |
22.11 |
24.14 |
|
Uttar Pradesh |
16.22 |
17.39 |
17.69 |
17.55 |
17.88 |
18.17 |
17.96 |
17.06 |
15.75 |
16.84 |
17.44 |
|
West Bengal |
13.73 |
15.36 |
16.89 |
16.84 |
17.07 |
16.77 |
16.74 |
17.83 |
18.33 |
18.30 |
18.45 |
|
All India |
18.61 |
18.97 |
17.78 |
18.10 |
17.96 |
18.11 |
18.11 |
18.17 |
17.64 |
18.04 |
18.84 |
|
(G) Harvesting
(Female) |
|||||||||||
|
|
1998–99 |
1999–2000 |
2000–01 |
2001–02 |
2002–03 |
2003–04 |
2004–05 |
2005–06 |
2006–07 |
2007–08 |
2008–09 |
|
Andhra Pradesh |
11.29 |
11.07 |
11.58 |
11.42 |
10.45 |
10.60 |
10.90 |
12.22 |
13.00 |
13.94 |
16.59 |
|
Assam |
15.42 |
15.93 |
16.00 |
16.86 |
15.52 |
15.93 |
16.62 |
16.80 |
17.77 |
16.42 |
15.73 |
|
Bihar |
11.63 |
11.90 |
13.69 |
14.56 |
16.25 |
16.22 |
16.00 |
15.62 |
14.23 |
13.96 |
14.64 |
|
Gujarat |
15.45 |
15.08 |
15.37 |
15.87 |
16.25 |
15.96 |
16.15 |
15.52 |
14.93 |
15.54 |
15.08 |
|
Haryana |
21.16 |
23.53 |
26.59 |
25.83 |
26.80 |
26.63 |
27.14 |
26.85 |
25.50 |
25.78 |
27.02 |
|
Himachal Pradesh |
25.19 |
26.89 |
na |
na |
na |
na |
na |
na |
na |
na |
na |
|
Jammu & Kashmir |
na |
na |
na |
na |
na |
na |
na |
na |
na |
na |
na |
|
Karnataka |
10.46 |
10.74 |
11.57 |
11.74 |
11.26 |
10.73 |
10.72 |
11.07 |
11.00 |
11.71 |
12.69 |
|
Kerala |
24.58 |
27.55 |
27.22 |
29.39 |
29.06 |
28.74 |
28.83 |
28.90 |
28.68 |
29.20 |
30.05 |
|
Madhya Pradesh |
11.48 |
11.71 |
12.03 |
12.52 |
12.42 |
12.41 |
12.34 |
11.79 |
10.94 |
11.59 |
11.76 |
|
Maharashtra |
10.27 |
10.67 |
11.60 |
11.88 |
11.81 |
10.87 |
10.53 |
10.27 |
11.26 |
10.82 |
10.96 |
|
Manipur |
14.92 |
15.13 |
na |
na |
15.26 |
18.04 |
17.97 |
17.03 |
16.62 |
16.56 |
17.56 |
|
Meghalaya |
13.87 |
13.10 |
na |
na |
14.19 |
16.02 |
14.99 |
14.96 |
14.43 |
13.89 |
13.08 |
|
Orissa |
12.00 |
10.52 |
11.69 |
11.44 |
13.29 |
12.82 |
13.37 |
14.22 |
10.77 |
10.14 |
14.02 |
|
Punjab |
18.51 |
17.82 |
na |
na |
na |
na |
na |
na |
na |
na |
na |
|
Rajasthan |
19.29 |
18.13 |
21.55 |
19.81 |
14.26 |
16.24 |
16.41 |
17.10 |
15.39 |
16.96 |
21.02 |
|
Tamil Nadu |
13.43 |
14.05 |
15.20 |
14.33 |
13.33 |
14.15 |
14.25 |
14.43 |
14.41 |
15.20 |
15.43 |
|
Tripura |
11.61 |
13.57 |
na |
na |
na |
na |
na |
na |
na |
na |
na |
|
Uttar Pradesh |
14.34 |
15.13 |
15.52 |
15.09 |
15.01 |
16.29 |
15.58 |
14.32 |
13.47 |
15.24 |
15.57 |
|
West Bengal |
12.57 |
14.15 |
15.46 |
15.50 |
15.98 |
15.62 |
15.21 |
16.33 |
16.78 |
16.67 |
16.65 |
|
All India |
15.39 |
15.92 |
14.75 |
14.75 |
14.82 |
14.97 |
14.91 |
14.82 |
14.35 |
14.94 |
15.49 |
|
(H) Carpenter (Male) |
|||||||||||
|
|
1998–99 |
1999–2000 |
2000–01 |
2001–02 |
2002–03 |
2003–04 |
2004–05 |
2005–06 |
2006–07 |
2007–08 |
2008–09 |
|
Andhra Pradesh |
20.83 |
22.44 |
23.78 |
24.25 |
23.45 |
23.25 |
22.46 |
22.80 |
22.20 |
22.71 |
25.22 |
|
Assam |
26.34 |
25.51 |
25.72 |
28.01 |
30.18 |
29.38 |
30.49 |
31.22 |
31.30 |
31.90 |
32.03 |
|
Bihar |
22.56 |
22.88 |
26.69 |
28.35 |
31.46 |
31.09 |
31.07 |
29.32 |
27.27 |
27.39 |
27.71 |
|
Gujarat |
36.57 |
35.52 |
37.05 |
37.94 |
37.85 |
37.21 |
37.74 |
36.15 |
34.26 |
33.78 |
33.51 |
|
Haryana |
39.45 |
44.69 |
44.87 |
41.28 |
42.66 |
41.46 |
40.01 |
39.71 |
37.46 |
38.59 |
41.36 |
|
Himachal Pradesh |
47.83 |
48.79 |
54.15 |
55.00 |
55.61 |
54.24 |
55.05 |
55.57 |
54.83 |
56.78 |
55.38 |
|
Jammu & Kashmir |
49.92 |
47.72 |
49.93 |
50.95 |
49.96 |
50.07 |
51.90 |
50.50 |
47.36 |
46.00 |
47.14 |
|
Karnataka |
22.36 |
25.71 |
30.12 |
31.25 |
30.58 |
28.86 |
27.62 |
28.86 |
27.71 |
27.74 |
27.51 |
|
Kerala |
52.53 |
54.23 |
54.29 |
56.58 |
58.08 |
56.94 |
56.02 |
57.29 |
59.55 |
59.57 |
60.19 |
|
Madhya Pradesh |
23.08 |
24.33 |
24.13 |
24.66 |
24.85 |
25.23 |
25.16 |
24.28 |
23.03 |
23.13 |
22.02 |
|
Maharashtra |
25.55 |
27.01 |
28.37 |
29.78 |
30.06 |
29.29 |
28.91 |
28.38 |
27.43 |
27.72 |
27.04 |
|
Manipur |
23.62 |
23.05 |
23.94 |
25.52 |
26.84 |
27.31 |
27.27 |
25.59 |
24.98 |
29.51 |
30.62 |
|
Meghalaya |
28.25 |
27.16 |
27.38 |
26.45 |
30.52 |
29.68 |
30.93 |
34.01 |
32.95 |
31.81 |
30.59 |
|
Orissa |
25.96 |
24.62 |
28.90 |
31.09 |
33.54 |
32.63 |
33.80 |
34.24 |
32.05 |
31.12 |
30.70 |
|
Punjab |
46.84 |
46.50 |
48.63 |
47.20 |
46.51 |
45.55 |
44.49 |
43.55 |
41.95 |
41.02 |
40.71 |
|
Rajasthan |
42.28 |
41.73 |
43.16 |
47.72 |
47.00 |
46.81 |
42.75 |
38.03 |
36.80 |
37.07 |
39.25 |
|
Tamil Nadu |
31.61 |
33.76 |
36.92 |
37.00 |
34.49 |
34.38 |
36.63 |
36.07 |
35.88 |
36.17 |
37.72 |
|
Tripura |
23.59 |
22.64 |
24.19 |
27.01 |
29.36 |
30.21 |
30.65 |
32.46 |
32.15 |
30.03 |
31.32 |
|
Uttar Pradesh |
29.33 |
31.30 |
34.15 |
34.13 |
34.66 |
34.57 |
34.58 |
33.49 |
31.55 |
31.23 |
31.47 |
|
West Bengal |
22.66 |
24.92 |
27.39 |
28.25 |
28.56 |
27.09 |
26.39 |
27.39 |
27.96 |
27.69 |
26.81 |
|
All India |
32.07 |
32.99 |
31.91 |
33.01 |
33.10 |
32.57 |
32.55 |
32.31 |
31.27 |
31.16 |
31.30 |
|
(I) Blacksmith (Male) |
|||||||||||
|
|
1998–99 |
1999–2000 |
2000–01 |
2001–02 |
2002–03 |
2003–04 |
2004–05 |
2005–06 |
2006–07 |
2007–08 |
2008–09 |
|
Andhra Pradesh |
17.57 |
19.63 |
21.08 |
21.47 |
20.92 |
20.66 |
19.84 |
19.43 |
18.46 |
19.04 |
19.54 |
|
Assam |
16.86 |
16.86 |
17.20 |
19.27 |
20.60 |
22.09 |
22.28 |
21.95 |
21.24 |
20.03 |
19.18 |
|
Bihar |
20.07 |
20.17 |
23.04 |
24.66 |
26.90 |
26.09 |
25.83 |
24.56 |
22.67 |
22.40 |
23.75 |
|
Gujarat |
34.48 |
39.10 |
39.08 |
na |
na |
na |
na |
na |
na |
na |
na |
|
Haryana |
34.92 |
39.60 |
40.13 |
35.66 |
36.11 |
34.84 |
32.59 |
32.83 |
31.15 |
31.27 |
29.63 |
|
Himachal Pradesh |
41.22 |
43.48 |
48.26 |
51.23 |
50.32 |
49.26 |
51.00 |
47.29 |
50.21 |
54.85 |
52.96 |
|
Jammu & Kashmir |
36.80 |
32.82 |
33.66 |
35.85 |
36.06 |
36.51 |
35.95 |
36.83 |
34.73 |
35.42 |
33.02 |
|
Karnataka |
18.82 |
20.46 |
24.24 |
25.32 |
24.07 |
22.15 |
21.98 |
22.58 |
21.13 |
20.74 |
21.05 |
|
Kerala |
46.78 |
47.84 |
46.58 |
48.05 |
49.89 |
49.33 |
50.63 |
53.83 |
55.75 |
56.13 |
59.30 |
|
Madhya Pradesh |
19.32 |
20.49 |
20.23 |
20.46 |
20.36 |
21.05 |
20.60 |
20.23 |
19.53 |
19.03 |
18.47 |
|
Maharashtra |
21.48 |
22.10 |
24.12 |
24.59 |
24.19 |
23.97 |
24.22 |
24.27 |
22.47 |
22.70 |
22.08 |
|
Manipur |
17.42 |
17.06 |
18.77 |
21.02 |
22.54 |
22.81 |
22.66 |
21.70 |
21.34 |
21.67 |
21.49 |
|
Meghalaya |
21.05 |
18.73 |
19.58 |
20.56 |
22.28 |
23.66 |
23.14 |
23.24 |
22.18 |
22.87 |
22.48 |
|
Orissa |
24.63 |
20.83 |
22.11 |
27.59 |
29.98 |
27.08 |
26.38 |
25.84 |
22.56 |
22.27 |
21.34 |
|
Punjab |
45.67 |
45.97 |
47.68 |
45.50 |
45.84 |
44.38 |
43.55 |
44.70 |
41.91 |
40.36 |
38.59 |
|
Rajasthan |
26.64 |
23.13 |
30.13 |
na |
na |
na |
na |
na |
na |
24.60 |
23.52 |
|
Tamil Nadu |
28.36 |
30.59 |
32.78 |
32.67 |
30.19 |
29.92 |
31.99 |
32.26 |
31.30 |
29.30 |
30.00 |
|
Tripura |
10.41 |
11.20 |
11.70 |
14.09 |
14.59 |
16.47 |
18.84 |
21.00 |
21.54 |
20.10 |
22.53 |
|
Uttar Pradesh |
26.50 |
27.04 |
29.34 |
29.30 |
29.50 |
30.73 |
30.53 |
29.85 |
28.20 |
28.00 |
27.16 |
|
West Bengal |
17.37 |
19.93 |
21.82 |
20.78 |
21.51 |
20.45 |
18.65 |
17.20 |
17.55 |
17.95 |
17.92 |
|
All India |
26.32 |
26.98 |
25.24 |
25.68 |
25.63 |
25.47 |
25.21 |
25.06 |
23.95 |
23.58 |
23.20 |
|
(J) Mason (Male) |
|||||||||||
|
|
1998–99 |
1999–2000 |
2000–01 |
2001–02 |
2002–03 |
2003–04 |
2004–05 |
2005–06 |
2006–07 |
2007–08 |
2008–09 |
|
Andhra Pradesh |
24.76 |
26.32 |
28.03 |
28.35 |
27.97 |
28.53 |
27.93 |
28.30 |
27.70 |
30.30 |
33.46 |
|
Assam |
26.61 |
26.41 |
26.61 |
29.81 |
30.66 |
31.63 |
32.83 |
33.46 |
33.16 |
33.09 |
32.72 |
|
Bihar |
26.33 |
26.81 |
30.28 |
32.89 |
34.68 |
34.95 |
34.74 |
33.37 |
30.78 |
31.70 |
31.74 |
|
Gujarat |
40.11 |
39.75 |
41.23 |
44.10 |
42.46 |
41.65 |
40.25 |
38.16 |
36.95 |
37.19 |
38.94 |
|
Haryana |
43.53 |
47.71 |
49.23 |
49.22 |
48.92 |
47.94 |
48.46 |
48.17 |
46.97 |
47.33 |
48.91 |
|
Himachal Pradesh |
48.36 |
48.84 |
53.79 |
54.12 |
54.62 |
54.85 |
55.33 |
54.15 |
52.99 |
55.02 |
52.49 |
|
Jammu & Kashmir |
51.22 |
49.61 |
50.82 |
52.60 |
51.04 |
53.22 |
52.88 |
51.07 |
47.24 |
45.26 |
46.49 |
|
Karnataka |
26.19 |
27.18 |
31.41 |
33.14 |
31.68 |
29.89 |
30.94 |
32.45 |
30.68 |
29.95 |
30.73 |
|
Kerala |
51.24 |
52.75 |
53.22 |
55.90 |
55.39 |
53.88 |
54.51 |
57.02 |
57.84 |
59.15 |
59.87 |
|
Madhya Pradesh |
28.94 |
29.48 |
29.06 |
29.69 |
29.60 |
30.35 |
29.84 |
29.03 |
27.48 |
27.82 |
26.92 |
|
Maharashtra |
27.42 |
29.21 |
30.36 |
32.49 |
33.25 |
32.91 |
33.17 |
32.88 |
31.44 |
31.68 |
32.30 |
|
Manipur |
24.20 |
23.71 |
24.43 |
26.15 |
26.39 |
27.03 |
26.97 |
25.76 |
25.31 |
na |
36.20 |
|
Meghalaya |
28.95 |
26.70 |
24.83 |
24.63 |
28.21 |
27.03 |
28.51 |
31.29 |
28.82 |
27.44 |
26.76 |
|
Orissa |
28.35 |
27.61 |
31.36 |
33.66 |
35.85 |
35.64 |
35.94 |
34.96 |
32.98 |
31.68 |
32.05 |
|
Punjab |
46.32 |
47.38 |
48.88 |
47.42 |
46.92 |
45.88 |
44.96 |
43.56 |
42.01 |
41.34 |
40.40 |
|
Rajasthan |
45.11 |
44.53 |
46.77 |
46.98 |
46.18 |
48.05 |
43.97 |
40.29 |
39.49 |
40.88 |
42.68 |
|
Tamil Nadu |
34.18 |
36.02 |
39.42 |
40.10 |
37.99 |
37.55 |
38.48 |
38.64 |
39.01 |
39.98 |
42.76 |
|
Tripura |
23.59 |
22.62 |
24.13 |
27.01 |
28.59 |
30.59 |
30.65 |
32.46 |
32.22 |
30.08 |
31.08 |
|
Uttar Pradesh |
32.69 |
35.06 |
37.94 |
38.13 |
38.47 |
38.23 |
38.21 |
36.47 |
34.77 |
34.22 |
33.94 |
|
West Bengal |
23.09 |
25.80 |
28.74 |
29.33 |
30.02 |
29.11 |
28.13 |
28.67 |
29.25 |
28.60 |
27.87 |
|
All India |
34.06 |
34.89 |
34.76 |
35.88 |
35.80 |
35.64 |
35.50 |
35.12 |
33.99 |
34.22 |
34.70 |
|
(K) Unskilled labour
(Male) |
|||||||||||
|
|
1998–99 |
1999–2000 |
2000–01 |
2001–02 |
2002–03 |
2003–04 |
2004–05 |
2005–06 |
2006–07 |
2007–08 |
2008–09 |
|
Andhra Pradesh |
13.44 |
14.40 |
14.94 |
14.78 |
14.22 |
14.19 |
13.99 |
14.33 |
14.44 |
16.18 |
19.13 |
|
Assam |
13.78 |
14.65 |
15.48 |
16.48 |
16.61 |
17.79 |
18.60 |
18.05 |
17.88 |
17.83 |
19.06 |
|
Bihar |
12.86 |
12.77 |
14.41 |
15.68 |
16.21 |
16.30 |
16.40 |
15.95 |
15.01 |
15.42 |
15.96 |
|
Gujarat |
14.98 |
14.11 |
14.51 |
15.54 |
15.71 |
15.48 |
14.62 |
13.78 |
13.61 |
14.60 |
15.21 |
|
Haryana |
22.78 |
23.71 |
26.53 |
26.61 |
26.28 |
25.60 |
24.81 |
24.89 |
24.25 |
25.49 |
27.14 |
|
Himachal Pradesh |
26.01 |
26.93 |
30.56 |
31.63 |
31.56 |
31.58 |
32.23 |
31.49 |
30.01 |
31.73 |
32.35 |
|
Jammu & Kashmir |
28.41 |
26.47 |
28.13 |
29.21 |
29.27 |
31.13 |
31.36 |
29.85 |
28.16 |
28.28 |
29.43 |
|
Karnataka |
12.22 |
12.08 |
13.63 |
13.95 |
13.79 |
13.27 |
13.36 |
14.15 |
13.64 |
13.89 |
14.54 |
|
Kerala |
38.42 |
39.96 |
39.84 |
42.06 |
42.57 |
42.16 |
41.57 |
41.93 |
43.32 |
43.63 |
46.18 |
|
Madhya Pradesh |
11.36 |
11.96 |
11.62 |
11.51 |
11.66 |
11.72 |
11.42 |
11.13 |
10.40 |
10.63 |
10.99 |
|
Maharashtra |
14.28 |
14.20 |
14.61 |
15.21 |
14.95 |
14.78 |
14.45 |
14.10 |
14.01 |
14.10 |
14.67 |
|
Manipur |
15.33 |
14.44 |
15.32 |
15.66 |
15.32 |
16.90 |
16.97 |
16.09 |
15.62 |
16.15 |
17.40 |
|
Meghalaya |
15.51 |
14.33 |
14.10 |
14.47 |
16.72 |
16.64 |
17.48 |
19.27 |
19.24 |
18.54 |
17.38 |
|
Orissa |
12.89 |
11.98 |
13.38 |
13.64 |
15.12 |
14.81 |
14.83 |
15.43 |
15.16 |
14.65 |
15.92 |
|
Punjab |
23.95 |
24.03 |
24.88 |
24.83 |
24.70 |
24.29 |
23.51 |
22.40 |
22.93 |
22.85 |
24.87 |
|
Rajasthan |
20.28 |
20.61 |
22.10 |
22.54 |
21.68 |
22.27 |
20.39 |
19.13 |
18.59 |
19.95 |
22.58 |
|
Tamil Nadu |
17.99 |
20.25 |
21.91 |
22.10 |
20.48 |
20.83 |
21.30 |
21.77 |
22.51 |
22.58 |
24.57 |
|
Tripura |
16.03 |
16.34 |
17.12 |
18.87 |
19.28 |
21.63 |
21.70 |
23.90 |
24.19 |
22.56 |
25.30 |
|
Uttar Pradesh |
16.00 |
16.52 |
17.68 |
17.56 |
17.49 |
17.61 |
17.51 |
16.57 |
16.03 |
16.87 |
18.34 |
|
West Bengal |
13.05 |
14.45 |
15.89 |
16.13 |
16.41 |
15.98 |
15.62 |
16.38 |
16.24 |
16.12 |
16.52 |
|
All India |
18.01 |
18.34 |
17.37 |
17.77 |
17.77 |
17.77 |
17.62 |
17.50 |
17.17 |
17.54 |
18.71 |
|
(L) Unskilled labour
(Female) |
|||||||||||
|
|
1998–99 |
1999–2000 |
2000–01 |
2001–02 |
2002–03 |
2003–04 |
2004–05 |
2005–06 |
2006–07 |
2007–08 |
2008–09 |
|
Andhra Pradesh |
9.81 |
10.17 |
10.56 |
10.85 |
10.56 |
10.46 |
9.93 |
10.37 |
10.49 |
11.70 |
13.72 |
|
Assam |
12.27 |
12.70 |
13.48 |
13.86 |
13.81 |
13.21 |
13.28 |
12.16 |
12.50 |
13.65 |
13.99 |
|
Bihar |
11.20 |
11.06 |
12.65 |
13.35 |
14.78 |
14.76 |
14.65 |
14.53 |
13.27 |
13.60 |
14.57 |
|
Gujarat |
13.85 |
12.81 |
13.82 |
14.69 |
15.34 |
14.99 |
13.99 |
13.19 |
13.08 |
14.07 |
14.86 |
|
Haryana |
19.90 |
21.15 |
24.50 |
24.65 |
24.50 |
24.43 |
23.83 |
23.99 |
23.01 |
23.68 |
26.65 |
|
Himachal Pradesh |
21.43 |
22.32 |
na |
na |
na |
na |
na |
na |
na |
na |
34.14 |
|
Jammu & Kashmir |
na |
na |
na |
na |
na |
na |
na |
na |
na |
na |
na |
|
Karnataka |
9.29 |
8.95 |
10.14 |
10.50 |
10.25 |
9.95 |
9.84 |
10.07 |
9.89 |
10.24 |
10.84 |
|
Kerala |
25.47 |
27.87 |
27.72 |
30.54 |
29.90 |
30.27 |
31.36 |
32.63 |
33.91 |
33.44 |
34.06 |
|
Madhya Pradesh |
10.10 |
10.65 |
10.12 |
9.94 |
9.86 |
9.92 |
9.68 |
9.52 |
8.95 |
9.21 |
9.47 |
|
Maharashtra |
9.95 |
9.70 |
9.63 |
9.79 |
9.72 |
9.48 |
9.22 |
8.97 |
8.84 |
9.21 |
9.48 |
|
Manipur |
13.64 |
13.50 |
13.70 |
14.62 |
14.74 |
15.82 |
15.88 |
14.69 |
14.16 |
14.13 |
15.31 |
|
Meghalaya |
13.46 |
12.01 |
na |
na |
na |
na |
na |
12.62 |
12.03 |
12.21 |
11.78 |
|
Orissa |
11.37 |
10.75 |
12.03 |
12.19 |
13.49 |
12.88 |
12.58 |
12.95 |
12.57 |
12.10 |
13.48 |
|
Punjab |
15.59 |
16.68 |
na |
na |
na |
na |
na |
19.75 |
na |
na |
na |
|
Rajasthan |
17.65 |
17.43 |
19.25 |
19.48 |
18.78 |
19.54 |
18.26 |
17.13 |
16.96 |
17.84 |
20.60 |
|
Tamil Nadu |
11.99 |
13.46 |
14.67 |
15.00 |
13.86 |
14.17 |
14.73 |
15.06 |
16.00 |
16.84 |
17.85 |
|
Tripura |
14.56 |
15.68 |
na |
na |
na |
na |
na |
na |
na |
na |
na |
|
Uttar Pradesh |
13.11 |
13.50 |
14.20 |
13.57 |
14.41 |
14.99 |
14.76 |
13.69 |
13.30 |
14.05 |
14.92 |
|
West Bengal |
11.49 |
12.49 |
14.34 |
14.72 |
14.58 |
14.35 |
14.20 |
14.74 |
14.37 |
14.28 |
14.87 |
|
All India |
14.19 |
14.46 |
12.99 |
13.26 |
13.36 |
13.28 |
13.06 |
13.13 |
12.86 |
13.29 |
14.21 |
Notes: The
CPIAL and CPIRL (1986–87 = 100) are used as deflators.
na: not
available.
Source: GOI, Wage Rates in Rural India,
various issues.
Levels of Real Wages
Regional variations in real wage rates are
significant. When we look at men’s real wage rates in 2008–09, we find that it
is the highest in Kerala for most occupations, followed
by the north-western States of Jammu & Kashmir, Himachal
Pradesh, Punjab, and Haryana. These five States
almost invariably have been at the top throughout the period. Wage rates are
very low in Madhya Pradesh, Bihar, Orissa, Uttar
Pradesh, and Karnataka. This pattern of regional variation is very similar to
that noted by Chavan and Bedamatta (2006).
It is seen that the wage rate for ploughing in Kerala is so high (Rs 64.07) that
it surpasses the wage rates for carpenter (Rs 60.19)
and mason (Rs 59.87). The difference in the wage rate
for ploughing between Kerala and the other States is
more than Rs 15. In the wage rates for transplanting
and harvesting, in which women also participate, on the other hand, the
difference between Kerala and the other States is not
much: less than Rs 5. A similar tendency can be
observed in Tamil Nadu too. It is also noticed that
West Bengal improved its ranking in 2008–09, compared to 1998–99.
Though women’s wage rates are not available for Himachal Pradesh, Jammu & Kashmir, and Punjab, the
ranking of States according to female wage rates is similar to that of males.
At the bottom lie Maharashtra, Madhya Pradesh,
Karnataka, Orissa, and Meghalaya.
The female wage rate in Andhra Pradesh, which was at the bottom in the late
1990s, rose substantially by 2008–09. West Bengal and Tamil Nadu
also improved their ranking during this period.
Growth of Real Wages
Taking into account the implementation of NREGA 2005,
the period under study is divided into two sub-periods: 1998–99 to 2004–05 and
2005–06 to 2008–09. Table 2 shows the average annual rate of growth of wages
for major agricultural and rural labour occupations during the two sub-periods.
Table 2 Average annual rate of growth of wages for major occupations in rural India in per cent
|
Ploughing |
Sowing |
Transplanting |
Transplanting |
|||||||||
|
1998–99 |
2005–06 |
1998–99 |
2005–06 |
1998–99 |
2005–06 |
1998–99 |
2005–06 |
|||||
|
Growth |
Growth |
Growth |
Growth |
Growth |
Growth |
Growth |
Growth |
|||||
|
Andhra Pradesh |
0.24 |
7.74** |
2.12** |
7.61** |
2.18 |
10.37* |
–0.69 |
12.35** |
||||
|
Assam |
–0.51 |
0.78 |
3.91** |
1.05 |
3.27** |
–0.54 |
0.82 |
–0.64 |
||||
|
Bihar |
4.63** |
1.23* |
3.85** |
–1.43 |
4.60** |
–1.70 |
5.34** |
–3.06 |
||||
|
Gujarat |
3.03** |
1.05 |
2.65** |
0.45 |
1.87* |
–0.15 |
2.41** |
–0.69 |
||||
|
Haryana |
1.06 |
2.22** |
1.17 |
1.34 |
1.68 |
0.65 |
2.02 |
|||||
|
Himachal Pradesh |
3.79** |
8.66** |
3.87* |
|||||||||
|
Jammu & Kashmir |
3.54** |
–4.66** |
6.54** |
–2.35 |
–2.95* |
|||||||
|
Karnataka |
2.10 |
1.77 |
0.38 |
3.58 |
1.53 |
–2.75* |
0.87 |
0.05 |
||||
|
Kerala |
2.74 |
2.64 |
2.48* |
0.30 |
1.65 |
–0.13 |
||||||
|
Madhya Pradesh |
1.40** |
1.89 |
1.50** |
–0.68 |
||||||||
|
Maharashtra |
1.06 |
3.30** |
1.68 |
2.93** |
3.10* |
–3.41** |
–0.25 |
–4.49* |
||||
|
Manipur |
3.62** |
7.73 |
1.33 |
1.49 |
1.44 |
|||||||
|
Meghalaya |
5.28** |
–5.52** |
4.92** |
–3.90** |
7.05** |
4.14 |
–4.27 |
|||||
|
Orissa |
5.44** |
–2.81 |
4.73** |
–3.08 |
4.39** |
–2.02 |
3.81** |
–7.03 |
||||
|
Punjab |
2.06** |
0.47 |
||||||||||
|
Rajasthan |
1.03 |
4.62 |
1.18 |
–2.50 |
||||||||
|
Tamil Nadu |
0.26 |
1.32 |
–0.41 |
2.27 |
0.33 |
1.89 |
–2.15* |
5.10** |
||||
|
Tripura |
6.52** |
0.47 |
5.95** |
0.45 |
6.28** |
0.43 |
||||||
|
Uttar Pradesh |
1.83* |
1.85 |
1.73* |
2.67 |
1.34 |
0.28 |
1.73 |
4.16 |
||||
|
West Bengal |
3.51** |
–0.92 |
2.48* |
0.41 |
2.97* |
1.50 |
3.50** |
–0.45 |
||||
|
All India |
1.36 |
0.22 |
–0.87 |
0.54 |
||||||||
|
Harvesting |
Harvesting (Female) |
Carpenter |
||||||||||
|
1998–99 |
2005–06 |
1998–99 |
2005–06 |
1998–99 |
2005–06 |
1998–99 |
2005–06 |
|||||
|
Growth |
Growth |
Growth |
Growth |
Growth |
Growth |
Growth |
Growth |
|||||
|
Andhra Pradesh |
0.31 |
9.33** |
–1.05 |
9.88** |
1.22 |
13.65** |
1.01 |
3.27 |
||||
|
Assam |
3.16** |
0.32 |
0.70 |
–2.77 |
3.15** |
0.96* |
||||||
|
Bihar |
5.88** |
–2.22 |
6.24** |
–2.14 |
4.43** |
–0.17 |
6.21** |
–1.65 |
||||
|
Gujarat |
0.76* |
–0.74 |
1.07** |
–0.45 |
1.03 |
1.10 |
0.75* |
–2.42* |
||||
|
Haryana |
2.38** |
0.41 |
3.58** |
0.30 |
2.51** |
–0.57 |
1.52 |
|||||
|
Himachal Pradesh |
4.65 |
2.36** |
0.25 |
|||||||||
|
Jammu & Kashmir |
3.96** |
–1.35 |
0.76 |
–2.36 |
||||||||
|
Karnataka |
1.58 |
2.37 |
0.17 |
4.73* |
0.64 |
0.06 |
3.14 |
–1.42 |
||||
|
Kerala |
2.24** |
1.35 |
0.86 |
1.18 |
1.28** |
1.48 |
||||||
|
Madhya Pradesh |
1.73** |
0.14 |
1.30** |
0.50 |
0.44 |
–0.71 |
1.29** |
–2.89* |
||||
|
Maharashtra |
2.47 |
2.94** |
0.47 |
1.57 |
–0.98 |
0.91 |
2.11** |
–1.35 |
||||
|
Manipur |
3.16** |
7.05 |
||||||||||
|
Meghalaya |
3.78* |
–5.47** |
1.99* |
–3.54** |
||||||||
|
Orissa |
3.57** |
0.52 |
3.03* |
–1.03 |
4.84** |
5.37** |
–3.56* |
|||||
|
Punjab |
1.96** |
0.72 |
–0.86 |
–2.24** |
||||||||
|
Rajasthan |
–2.68 |
5.15 |
–3.99 |
7.16 |
–3.85 |
4.93 |
1.25 |
1.02 |
||||
|
Tamil Nadu |
–0.04 |
4.10* |
0.22 |
2.54* |
–0.23 |
3.96** |
1.46 |
1.42 |
||||
|
Tripura |
6.58** |
0.51 |
5.56** |
–1.76 |
||||||||
|
Uttar Pradesh |
1.44** |
1.34 |
1.30* |
3.74 |
2.72* |
3.27 |
2.53** |
–1.97 |
||||
|
West Bengal |
2.79* |
1.00 |
2.86* |
0.52 |
2.96** |
0.80 |
2.38 |
–0.73 |
||||
|
All India |
1.32 |
1.74 |
2.47 |
–0.98 |
||||||||
|
Blacksmith |
Mason |
Unskilled Labour |
Unskilled Labour |
|||||||||
|
1998–99 |
2005–06 |
1998–99 |
2005–06 |
1998–99 |
2005–06 |
1998–99 |
2005–06 |
|||||
|
Growth |
Growth |
Growth |
Growth |
Growth |
Growth |
Growth |
Growth |
|||||
|
Andhra Pradesh |
1.64 |
0.48 |
1.86** |
5.93 |
0.15 |
9.81* |
0.34 |
9.48* |
||||
|
Assam |
5.56** |
–4.64** |
4.04** |
–0.69** |
4.85** |
1.60 |
1.21 |
5.08** |
||||
|
Bihar |
5.09** |
–1.13 |
5.35** |
–1.21 |
4.76** |
0.30 |
5.49** |
0.32 |
||||
|
Gujarat |
0.48 |
0.67 |
0.69 |
3.67* |
1.60 |
4.31* |
||||||
|
Haryana |
–2.03 |
–3.03* |
1.16 |
0.53 |
1.43 |
3.08 |
2.96* |
3.44 |
||||
|
Himachal Pradesh |
3.32** |
4.28 |
2.33** |
–0.56 |
3.55** |
1.37 |
||||||
|
Jammu & Kashmir |
0.76 |
–3.08 |
0.86* |
–3.25 |
2.36** |
–0.38 |
||||||
|
Karnataka |
2.21 |
–2.29 |
2.49 |
–1.88 |
1.67 |
0.98 |
1.41 |
2.55 |
||||
|
Kerala |
1.31** |
2.97** |
0.96* |
1.69** |
1.46** |
2.96** |
3.09** |
1.14 |
||||
|
Madhya Pradesh |
0.90* |
–2.99** |
0.60** |
–2.14 |
–0.08 |
–0.17 |
–1.06* |
0.15 |
||||
|
Maharashtra |
1.88** |
–2.74 |
3.21** |
–0.46 |
0.49 |
1.24 |
–0.95** |
2.04 |
||||
|
Manipur |
5.54** |
–0.15 |
2.38** |
2.21** |
2.69 |
3.02** |
1.22 |
|||||
|
Meghalaya |
3.15** |
–0.69 |
0.38 |
–5.18** |
2.96 |
–3.47* |
–1.92 |
|||||
|
Orissa |
3.70 |
–5.87* |
4.84** |
–3.01 |
3.45** |
0.60 |
2.78** |
0.84 |
||||
|
Punjab |
–0.90* |
–4.79** |
–0.69 |
–2.42** |
–0.15 |
3.10 |
||||||
|
Rajasthan |
0.22 |
2.07 |
0.54 |
5.67 |
1.09 |
6.04 |
||||||
|
Tamil Nadu |
0.84 |
–2.84 |
1.43 |
3.28* |
1.77 |
3.66* |
2.37 |
5.62** |
||||
|
Tripura |
9.90** |
1.43 |
5.57** |
–1.99 |
5.68** |
1.00 |
||||||
|
Uttar Pradesh |
2.45** |
–2.90** |
2.34** |
–2.32* |
1.39** |
3.56 |
2.07** |
3.12 |
||||
|
West Bengal |
0.89 |
1.46* |
3.13* |
–1.08 |
2.76* |
0.18 |
3.32** |
0.19 |
||||
|
All India |
–2.47** |
–0.29 |
0.18 |
2.71 |
||||||||
Note: (1) Since the all–India averages in 1998–99 and 1999–2000 are simple arithmetic means of the figures for 20 States and hence not compatible with the later years, the growth rate is not computed here.
(2) * and ** stand for significance level at 10 and 5 per cent, respectively.
Source: GOI, Wage Rates in Rural India, various issues.
The annual growth rate of real wages
differs significantly across regions, among occupations, and also between the
sub-periods.
During the first sub-period (1998–99 to 2004–05),
agricultural wage rates rose as a whole. There were some cases of negative
growth, but they are not statistically significant. Not only high wage rate
regions, like Kerala, Himachal
Pradesh, and Jammu & Kashmir, but also low wage rate regions, such as
Bihar, Gujarat, Orissa, Tripura,
and West Bengal, recorded positive growth in men’s wage rates for major
agricultural operations. Wage rates did not rise or remained stagnant in some
States, including Maharashtra, Madhya Pradesh, Tamil Nadu, and Karnataka.
Female wage rates rose markedly in Bihar, Orissa, West Bengal, and Meghalaya,
while they declined or remained stagnant in Karnataka, Maharashtra,
Andhra Pradesh, Tamil Nadu, and Rajasthan. There is
no correlation between the growth rate and initial wage rate for agricultural
operations.
Wage rates for non-agricultural occupations grew not
only in the States that recorded a high growth rate for agricultural wages, but
also in the States where agricultural wages remained stagnant or declined,
namely Karnataka, Maharashtra, Uttar Pradesh, and
West Bengal. On the other hand, wage rates for non-farm occupations declined or
remained stagnant in Punjab, Haryana, Jammu &
Kashmir, Gujarat, Rajasthan, and Madhya Pradesh. Thus, an inverse relation can
be observed between the growth rate and initial level of wages for non-agricultural
occupations, which led to a narrowing of the regional wage gap.
During the second sub-period (2005–06 to 2008–09),
most of the estimated growth rates are statistically insignificant due to the
smaller number of samples and a large fluctuation inbetween.
It is therefore quite difficult to find any definite trends, except in a few
cases. One exception is Andhra Pradesh, where a rapid growth of agricultural
wages was recorded. The wage rates for all farm operations and non-farm
occupations in Andhra Pradesh rose very rapidly, at more than 10 per cent a
year. Tamil Nadu also recorded an improvement in
agricultural wage rates, though not as fast as in Andhra Pradesh. In Maharashtra, agricultural wage rates grew for all
operations except transplanting. On the other hand, Jammu & Kashmir and Meghalaya recorded negative growth in ploughing and sowing.
According to the growth rates based on the wage rates
of the initial and terminal years, 13 States, including Andhra Pradesh, Haryana, Himachal Pradesh, Karnataka,
Kerala, Maharashtra,
Manipur, Punjab, Rajasthan, Tamil Nadu, Tripura, Uttar Pradesh, and West Bengal, recorded positive
growth for a majority of farm operations. The remaining 7 States recorded
negative growth rates for a majority of farm operations.
In contrast to the first sub-period, the second
sub-period saw negative growth in wage rates for non-agricultural occupations
in many States. The growth rates of wages for carpenters, blacksmiths, and
masons were negative in most of the States, and about a half of these are
statistically significant. On the other hand, the growth rates for both male
and female unskilled labour were positive in most of the States, though only a
few are statistically significant. The growth rates of unskilled labour wages,
based on the wage rates of the initial and terminal years, were positive for
all States other than Madhya Pradesh and Meghalaya.
It is noteworthy that the wage rates for female unskilled labour grew more
rapidly than that for males in Andhra Pradesh, Assam, Gujarat, Haryana, Karnataka, Rajasthan, and Tamil
Nadu.
How has the regional variation changed? Figure 1 shows
the coefficient of variation (CV) of wage rates for major occupations. Note
that the CV depends on availability of Kerala data.
The CV of wage rate for ploughing corresponds closely to the fluctuation of the
wage rate in Kerala, and the lower CVs for
transplanting and harvesting than for ploughing and sowing are mainly due to
non-availability of Kerala data. In spite of this
limitation, we can safely say that regional disparities in wage rates narrowed
in the first sub-period, that is, from 1998–99 to 2004–05. By contrast, the CVs
ceased to decline, and the CVs of wage rates for blacksmith and female
unskilled labourer rose during the second sub-period. In other words, regional
disparities in non-farm wage rates widened from 2005–06 to 2008–09.
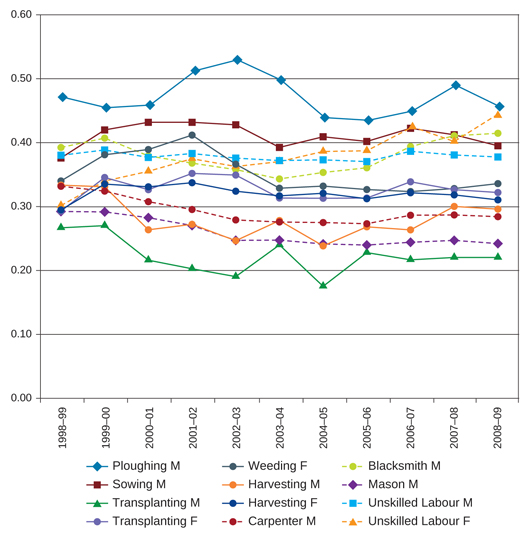
Figure 1 Change in regional variation of wage rates
Source: GOI, Wage Rates in Rural India, various issues.
Wage Differentials
Between Agricultural Labour and Rural Non-Farm Labour
One of the merits of the WRRI data is that they allow us to analyse the wage differentials
between various occupations. In order to examine the pattern of wage
differentials between agricultural labour and rural non-farm labour, the ratio
of the wage rate for mason and unskilled labourer to the wage rate for
ploughing and harvesting for males, and the ratio of the wage rate for
unskilled labourer to weeding and harvesting for females, are worked out. A
three-year average is taken for comparison of the beginning and end of the
period under study.
Table 3 Wage differentials between agricultural labour and rural non–farm labour
|
|
Male 1998–99 to 2000–01 |
Male 2006–07 to 2008–09 |
Female 1998–99 |
Female 2006–07 |
||||||||
|
|
Mason/ |
Unskilled/ |
Mason/ |
Unskilled/ |
Mason/ |
Unskilled/ |
Mason/ |
Unskilled/ |
Unskilled/ |
Unskilled/ |
Unskilled/ |
Unskilled/ |
|
Andhra Pradesh |
1.55 |
0.84 |
1.86 |
1.00 |
1.47 |
0.80 |
1.68 |
0.91 |
1.10 |
0.90 |
0.94 |
0.83 |
|
Assam |
1.31 |
0.72 |
1.65 |
0.91 |
1.73 |
0.96 |
1.75 |
0.97 |
0.79 |
0.81 |
0.82 |
0.80 |
|
Bihar |
1.81 |
0.87 |
2.02 |
0.97 |
1.69 |
0.83 |
2.04 |
1.00 |
1.02 |
0.94 |
1.11 |
0.97 |
|
Gujarat |
2.23 |
0.80 |
2.56 |
0.92 |
1.83 |
0.70 |
2.40 |
0.92 |
0.91 |
0.88 |
0.93 |
0.92 |
|
Haryana |
1.91 |
0.99 |
1.87 |
0.97 |
1.87 |
1.00 |
1.78 |
0.96 |
1.07 |
0.92 |
1.00 |
0.94 |
|
Himachal Pradesh |
1.58 |
0.88 |
1.84 |
1.02 |
1.22 |
0.72 |
1.54 |
0.91 |
0.83 |
0.84 |
na |
na |
|
Jammu & Kashmir |
1.65 |
0.90 |
1.84 |
1.01 |
1.49 |
0.92 |
1.57 |
0.97 |
na |
na |
na |
na |
|
Karnataka |
1.76 |
0.79 |
1.90 |
0.85 |
1.69 |
0.78 |
1.89 |
0.87 |
0.88 |
0.87 |
0.96 |
0.88 |
|
Kerala |
0.89 |
0.67 |
1.43 |
1.07 |
0.91 |
0.69 |
1.75 |
1.32 |
0.92 |
1.02 |
1.13 |
1.15 |
|
Madhya Pradesh |
2.00 |
0.80 |
2.19 |
0.88 |
1.85 |
0.72 |
2.10 |
0.82 |
0.92 |
0.88 |
0.88 |
0.81 |
|
Maharashtra |
1.61 |
0.80 |
1.85 |
0.92 |
1.69 |
0.76 |
1.85 |
0.83 |
0.94 |
0.90 |
0.91 |
0.83 |
|
Manipur |
1.26 |
0.79 |
1.40 |
0.87 |
1.27 |
0.68 |
1.64 |
0.88 |
1.02 |
0.91 |
0.87 |
0.86 |
|
Meghalaya |
1.57 |
0.86 |
1.64 |
0.89 |
1.39 |
0.93 |
1.33 |
0.88 |
1.07 |
0.94 |
0.91 |
0.87 |
|
Orissa |
2.08 |
0.91 |
2.17 |
0.95 |
1.98 |
0.93 |
2.15 |
1.01 |
1.01 |
1.00 |
0.96 |
1.09 |
|
Punjab |
2.22 |
1.14 |
2.03 |
1.04 |
na |
na |
1.70 |
0.97 |
0.83 |
0.89 |
na |
na |
|
Rajasthan |
1.79 |
0.82 |
2.00 |
0.92 |
1.66 |
0.82 |
2.07 |
1.03 |
0.99 |
0.92 |
1.13 |
1.04 |
|
Tamil Nadu |
1.07 |
0.59 |
1.81 |
0.99 |
1.22 |
0.70 |
1.88 |
1.08 |
1.13 |
0.94 |
1.27 |
1.13 |
|
Tripura |
1.48 |
1.04 |
1.48 |
1.04 |
1.34 |
1.03 |
1.34 |
1.03 |
1.17 |
1.20 |
na |
na |
|
Uttar Pradesh |
2.07 |
0.98 |
2.06 |
0.98 |
1.98 |
0.99 |
2.06 |
1.02 |
1.01 |
0.91 |
0.98 |
0.95 |
|
West Bengal |
1.16 |
0.65 |
1.69 |
0.94 |
1.05 |
0.60 |
1.56 |
0.89 |
0.92 |
0.91 |
0.89 |
0.87 |
|
India |
1.57 |
0.81 |
1.87 |
0.97 |
1.59 |
0.82 |
1.89 |
0.98 |
0.96 |
0.90 |
0.95 |
0.90 |
Source: GOI, Wage Rates in Rural India, various issues.
When compared to agricultural wages, the wage rate for
mason is seen to be much higher than the wage rate for ploughing in all States
except Kerala, where the latter wage rate is higher
than the former. The wage rate for mason is almost double the wage rate for
ploughing in Gujarat, Orissa, and Punjab. The
difference is comparatively small in West Bengal and Tamil Nadu.
The wage rate for unskilled labourer is generally
lower than the wage rate for ploughing, though the former is higher in Punjab,
and both are almost at the same level in Haryana, Tripura, and Uttar Pradesh. When the wage rates for
unskilled labourer and harvesting are compared, both are seen to be at almost
the same level in all States except in Karnataka, Madhya Pradesh, Maharashtra, and Manipur, where the wage rate for unskilled
labourer is lower by more than 10 per cent.
For female workers, the wage rate for unskilled labourer
is almost at the same level as the wage rate for harvesting and weeding, except
in Kerala and Tamil Nadu.
It is thus observed that the wage rate for a skilled
labourer such as a mason is much higher than an agricultural wage, but the wage
rates for unskilled labourers, both male and female, are at almost the same
level as agricultural wages.
Male–female Wage Differentials
The WRRI
data allow us to compare the wage gap between men and women for the same
occupation. The ratios of female to male wage rates for transplanting,
harvesting, and unskilled labour are worked out. To compare with the female WPR
(work participation rates) estimated by the Employment and Unemployment survey
of the NSS (National Sample Survey), three-year averages are taken for 1998–99
to 2000–01 and 2003–04 to 2005–06. To see recent changes, the three-year
average for the end of the period is added.
Table 4 Change in female–male wage ratios
|
|
1999–2000 |
1998–99
to 2000–01 |
2004–05 |
2003–04
to 2005–0606 |
2006–07
to 2008–09 |
||||||
|
|
Female
WPR |
Harvesting |
Trans–planting
|
Unskilled
Labour |
Female
WPR |
Harvesting |
Trans–planting
|
Unskilled
Labour |
Harvesting |
Trans–planting
|
Unskilled
Labour |
|
Andhra Pradesh |
478 |
0.80 |
0.77 |
0.71 |
483 |
0.76 |
0.67 |
0.72 |
0.72 |
0.80 |
0.72 |
|
Assam |
151 |
0.98 |
0.91 |
0.88 |
209 |
0.88 |
0.82 |
0.71 |
0.84 |
0.88 |
0.73 |
|
Bihar |
173 |
0.90 |
0.91 |
0.87 |
199 |
0.93 |
0.94 |
0.90 |
0.93 |
0.93 |
0.89 |
|
Gujarat |
413 |
0.97 |
0.95 |
0.93 |
427 |
0.98 |
0.98 |
0.96 |
0.96 |
0.97 |
0.97 |
|
Haryana |
202 |
0.95 |
0.69 |
0.90 |
317 |
0.99 |
0.91 |
0.96 |
0.96 |
0.97 |
0.95 |
|
Himachal Pradesh |
471 |
0.95 |
0.95 |
0.79 |
506 |
na |
na |
na |
na |
na |
na |
|
Jammu & Kashmir |
327 |
na |
na |
na |
267 |
na |
na |
na |
na |
na |
na |
|
Karnataka |
380 |
0.73 |
0.78 |
0.75 |
459 |
0.69 |
0.75 |
0.73 |
0.77 |
0.73 |
0.74 |
|
Kerala |
238 |
0.72 |
0.93 |
0.69 |
256 |
na |
na |
0.75 |
na |
0.87 |
0.76 |
|
Madhya Pradesh |
382 |
0.88 |
0.92 |
0.88 |
396 |
0.87 |
0.88 |
0.85 |
0.89 |
0.87 |
0.86 |
|
Maharashtra |
434 |
0.69 |
0.75 |
0.68 |
474 |
0.63 |
0.67 |
0.64 |
0.68 |
0.64 |
0.64 |
|
Manipur |
253 |
0.87 |
0.84 |
0.91 |
351 |
0.92 |
0.91 |
0.93 |
0.91 |
0.90 |
0.89 |
|
Meghalaya |
418 |
0.82 |
0.74 |
0.87 |
478 |
0.69 |
0.64 |
0.71 |
0.71 |
0.66 |
0.65 |
|
Orissa |
299 |
0.85 |
0.85 |
0.89 |
322 |
0.84 |
0.85 |
0.85 |
0.76 |
0.77 |
0.83 |
|
Punjab |
280 |
0.78 |
0.76 |
0.66 |
322 |
na |
na |
0.84 |
na |
na |
na |
|
Rajasthan |
388 |
0.86 |
na |
0.86 |
407 |
0.84 |
na |
0.89 |
na |
0.90 |
0.91 |
|
Tamil Nadu |
430 |
0.70 |
0.64 |
0.67 |
461 |
0.72 |
0.58 |
0.69 |
0.64 |
0.70 |
0.73 |
|
Tripura |
73 |
0.79 |
0.83 |
0.92 |
85 |
na |
na |
na |
na |
na |
na |
|
Uttar Pradesh |
201 |
0.88 |
0.87 |
0.81 |
266 |
0.87 |
0.87 |
0.84 |
0.89 |
0.89 |
0.83 |
|
West Bengal |
160 |
0.92 |
0.90 |
0.88 |
178 |
0.92 |
0.93 |
0.90 |
0.88 |
0.91 |
0.89 |
|
India |
299 |
0.83 |
0.85 |
0.78 |
327 |
0.82 |
0.82 |
0.75 |
0.83 |
0.82 |
0.76 |
Note: WPR refers to female workers per 1,000 females.
Source: GOI, Wage
Rates in Rural India, various issues.
First, transplanting and harvesting. There is a
substantial regional variation in the male–female wage disparity. The ratios
indicate that the male–female wage disparity is relatively large in Andhra
Pradesh, Karnataka, Kerala, Maharashtra,
Meghalaya, and Tamil Nadu,
while it is rather small in Bihar, Gujarat, Haryana,
Manipur, and West Bengal. Male–female wage disparities have persisted over the
last 10 years.
The regional pattern of the male–female wage gap for
unskilled labour is similar to that for transplanting and harvesting: it is
larger in Andhra Pradesh, Assam, Karnataka, Kerala, Maharashtra, Meghalaya, and Tamil
Nadu than elsewhere.
Excluding the exceptional cases of Gujarat and Himachal Pradesh, the coefficient of correlation between
the female–male wage differential for harvesting and female WPR is 0.66 for
1999–2000 and 0.65 for 2004–05, while that for transplanting is 0.61 for
1999–2000 and 0.73 for 2004–05. The male–female disparity is higher in States
where female WPR is higher.
Comparison with Average Wage Rates
in MGNREGA
The fixed wage and average wage paid under the Mahatma
Gandhi National Rural Employment Guarantee Act (MGNREGA) in 2008–09 are
reported for each State on the website of the MGNREGA.3 The MGNREGA
average wage is calculated by dividing the total wage bill by total employment.
Wage rates under the MGNREGA are supposed to be the same for men and women, but
the average wage paid is much lower than the fixed wage in many States.
Table 5 Comparison between the average wage paid under MGNREGA and the wage rate for unskilled labour in WRRI
|
MGNREGA
|
Wage rate for unskilled labour, WRRI |
||
|
|
Average
wage paid |
Male |
Female |
|
Andhra Pradesh |
na |
86.90 |
61.92 |
|
Assam |
77.58 |
83.32 |
61.28 |
|
Bihar |
87.97 |
68.97 |
62.72 |
|
Gujarat |
81.90 |
68.19 |
66.57 |
|
Haryana |
138.74 |
128.16 |
124.01 |
|
Himachal Pradesh |
101.08 |
133.01 |
142.29 |
|
Jammu & Kashmir |
71.67 |
127.14 |
|
|
Karnataka |
78.97 |
63.92 |
47.59 |
|
Kerala |
123.99 |
198.70 |
147.12 |
|
Madhya Pradesh |
77.19 |
48.97 |
42.01 |
|
Maharashtra |
89.92 |
66.48 |
42.83 |
|
Manipur |
81.35 |
67.64 |
59.68 |
|
Meghalaya |
69.98 |
82.41 |
56.21 |
|
Orissa |
88.19 |
65.86 |
55.65 |
|
Punjab |
114.83 |
119.14 |
|
|
Rajasthan |
84.35 |
104.03 |
93.81 |
|
Tamil Nadu |
71.99 |
106.07 |
77.04 |
|
Tripura |
86.88 |
102.13 |
|
|
Uttar Pradesh |
99.84 |
82.31 |
67.37 |
|
West Bengal |
81.57 |
69.93 |
62.95 |
Source: http://nrega.nic.in/netnrega/home.aspx, Ministry of Rural Development; and GOI, Wage Rates in Rural India, various issues.
The average wage paid under MGNREGA is much higher
than the wage rates for male unskilled labour in ten States, and it is lower
than the male wage rates but higher than the female wage rates in Assam and Meghalaya. Surprisingly, the average wage paid under
MGNREGA is lower than the wage rates for female unskilled labour in Himachal Pradesh, Kerala,
Rajasthan, and Tamil Nadu.
It is assumed that creation of employment opportunity
in manual works at a comparatively higher wage rate under MGNREGA will cause
the market wage rate, in particular the wages for female unskilled labour, to
rise. If so, a positive correlation is expected between the ratio of MGNREGA
average wage to market wage rate, on the one hand, and the growth rate of
female unskilled labour wages, on the other. The correlation coefficient
between the two indicators was –0.37 in 15 states for which data are available,
while it was –0.88 in 8 states where the wage rate grew faster than 2 per cent
per annum. The growth of wage rate for female unskilled labour was slower in
States where the average wage paid under MGNREGA is higher than the market wage
rate.
If the MGNREGA has had a positive impact on wage rates
in agriculture, that impact is yet to be seen in the
data published by the Labour Bureau in the WRRI
series.4
Conclusions
In spite of various limitations, the WRRI provides a useful data-set with
which to analyse recent trends in agricultural and non-agricultural wages. The
annual real wage rates for ploughing, sowing, transplanting, weeding, and
harvesting for agricultural labour, and that of carpenter, blacksmith, mason,
and unskilled labour, are tabulated for 1998–99 to 2008–09 using the CPIAL and
CPIRL (1986–87 = 100). During the first sub-period (1998–99 to 2004–05),
agricultural and rural non-farm wage rates rose in most States. Not only high wage rate regions, but also low wage rate regions recorded
positive growth in real wage rates, and regional disparities in terms of
coefficients of variation decreased. The second sub-period (2005–06 to 2008–09),
on the other hand, saw a decline in real wage rates in most occupations and in
many States, except for a few like Andhra Pradesh. This was partly due to the
fact that nominal wage rates grew fast, but the deflator, i.e. CPIAL and CPIRL,
rose much faster. A comparison between the real wage rates of agricultural and
non-farm labour shows that the wage rate for unskilled labour is at a level
almost similar to that for agricultural labour. It is also noticed that the
male–female wage gap in agricultural labour is correlated to the female
worker–population ratio. Thus, in spite of growing agricultural production and
implementation of MGNREGA 2005, the real wages of agricultural labourers and
non-farm manual labourers have not yet shown any rise,
and regional wage gaps remained stagnant or even widened for female unskilled labourers.
Keywords: agricultural wages in India, wage rates for rural labourers, MGNREGA, male–female wage gap
Notes
1 Chavan and Bedamatta (2006) discuss five such limitations of the AWI data: the definition of wage, reporting errors by untrained agencies, lack of standardization of data collection, small sample size, and frequent changes in centres/villages.

2
There have been debates as to whether the CPIAL reflects the actual price levels in
rural
3 Home page of the MGNREGA, http://nrega.nic.in/netnrega/home.aspx, viewed on 22 March 2011.
4 Chandrasekhar and Ghosh (2011) have recently argued that the MGNREGA has had a favourable impact on female wages, leading to a reduction in the gender gap. The above discussion confirms that the wage rate for female unskilled labour grew faster during the second sub-period. I believe, however, that further detailed analysis is required to see if the MGNREGA is the cause for this rise in the female wage rate.
References
|
Chandrasekhar, C. P., and Ghosh, Jayati (2011), “Public Works and Wages in Rural
India,” http://www.macroscan.org/fet/jan11/fet110111Public_Works.htm.
|
|
|
Chavan, P., and Bedamatta, R. (2006), “Trend in Agricultural Wages in India,” Economic
and Political Weekly, 41, 38, 23 September.
|
|
|
Government of India (GOI),
Ministry of Labour and Employment, Labour Bureau, Wage Rates in Rural
India, various issues.
|