

ARCHIVE
Vol. 15, No. 1
JANUARY-JUNE, 2025
Editorial
Research Articles
Research Notes and Statistics
Obituary
Book Reviews
Educational Achievements and Gaps: Insights from Longitudinal Village Studies in Uttar Pradesh
*Research Associate, Foundation for Agrarian Studies, daya@fas.org.in
†Professor, Indian Statistical Institute, Bengaluru
https://doi.org/10.25003/RAS.15.01.0003
Abstract: This paper examines achievements and gaps in the progress of literacy and school education in rural Uttar Pradesh. The analysis in the paper is based on longitudinal data from two villages surveyed in 2006 and 2023 by the Foundation for Agrarian Studies. It examines changes in literacy, the number of years of schooling completed by individuals, and data on school attendance, disaggregated by gender, caste, and class. Mahatwar, in eastern Uttar Pradesh, is a Dalit-majority village dependent on non-agricultural incomes and characterised by relatively low agricultural productivity. Harevli in western Uttar Pradesh, by contrast, is a multi-caste village with a more dynamic agrarian economy and higher absolute incomes. While data from both villages show a substantial rise in overall literacy, the gender gap with respect to literacy has widened in Harevli. Neither village has attained universal literacy. Educational progress is evident among younger cohorts, while illiteracy is concentrated among older generations, particularly older women. The mean number of completed years of schooling among individuals has increased significantly. The number of women graduates has risen in both villages. School attendance and enrolment among children have increased, with a growing bias towards enrolment in private institutions. Dropout rates rise after the age of 14, especially among children from Scheduled Caste households.
Keywords: Literacy, educational attainment, gender gap, caste, class disparity, school enrolment, attendance, Uttar Pradesh, village studies
Introduction
This paper uses longitudinal data from two villages of Uttar Pradesh to explore progress in educational attainments among adults and school-going children over the 17-year period from 2006 to 2023. Data from two rounds of village surveys, conducted as part of the Project on Agrarian Relations in India (PARI) of the Foundation for Agrarian Studies, provide detailed information on education disaggregated by gender, age, caste, and class. The paper fills a gap in our understanding of rural education, as there has been no Census since 2011.
The surveys were conducted in the villages of Harevli, Najibabad block, Bijnor district, in the western region of Uttar Pradesh and Mahatwar, Rasra block, Ballia district, in the eastern region of Uttar Pradesh.1 In 2006, a census-type survey covering all households was conducted in both villages. In 2023, a census survey was conducted in Harevli. In Mahatwar, however, there was a two-stage survey. First, a household census collected data on a set of variables that included demographic details including educational attainment, as well as land and asset holdings. A sample drawn from this census was used to collect data on income-related variables as well as additional information on schooling.2 In this paper, all statistical tables are based on two rounds of census survey in the villages.
In Mahatwar, the number of households increased from 156 in 2006 to 218 in 2023; total population grew from 1,130 to 1,379 persons. The Scheduled Caste persons comprise the majority of the population (62 per cent), followed by persons from Other Backward Classes (OBC), 28 per cent, and Other Castes (OC), 9 per cent. In 2023, the Jatava caste (Scheduled Caste) was the biggest numerically, followed by the Yadav caste (Other Backward Class).
In Harevli, the 2006 census recorded 109 households and 661 persons, while the 2023 resurvey reported 129 households and 750 persons (including migrants). The sex ratio in Harevli showed an improvement over 2006. Harevli is a multi-caste village: 30 per cent of the population belonged to Scheduled Castes (SC), 34 per cent to Other Backward Classes (OBC), and 29 per cent to Other Castes (OC). The remaining 7 per cent were Muslims.3
In the PARI surveys, a person was classified as literate only if she could read and write (not just sign her name). The PARI data record attendance not enrolment, as we distinguished children who attended school regularly from those who were enrolled but did not attend school for long stretches (of at least 30 days).
Educational Attainment Among Adults
Literacy
According to the 75th round of the National Sample Survey (NSS) on Household Social Consumption: Education, 2018, the literacy rate in rural Uttar Pradesh among persons aged seven years and above was 80.5 per cent for males, 60.4 per cent for females, and 70.8 per cent for all persons.
Mahatwar
According to the Census of India, 2011, the literacy rate was 59.9 per cent in Mahatwar for all persons (52.3 per cent for females, and 67.6 per cent for males). Longitudinal data from the village show that the overall literacy rate rose from 56 per cent in 2006 to 79 per cent in 2023 (Appendix Table 1).4 The overall literacy rate for females rose from 43 per cent in 2006 to 67 per cent in 2023; the corresponding change was from 70 per cent to 88 per cent for males. While there has been a big jump in literacy over the last two decades, nevertheless, universal literacy has not been attained.
Secondly, there remains a significant gender gap (male minus female literacy rate): the gender gap was 27 percentage points in 2006 and 21 percentage points in 2023 (Table 1). If we look at the gender gap for each social group, the narrowing of the gap was the highest among Scheduled Castes.5 In other words, over this 17-year period, the speed of change in acquiring literacy was faster among females than males in Mahatwar village.
Table 1 Gender gap (male minus female literacy rate) for persons aged 7 and above, by social group, Mahatwar and Harevli, 2006 and 2023 in percentage points
| Social group | Mahatwar | Harevli | ||
| 2006 | 2023 | 2006 | 2023 | |
| Scheduled Castes (SC) | 31 | 22 | 6 | 27 |
| Other Backward Classes (OBC) | 27 | 21 | 24 | 23 |
| Other Caste Hindus (OC) | 19 | 17 | 15 | 8 |
| Muslims | - | - | 7 | 22 |
| All | 27 | 21 | 15 | 19 |
Source: Project on Agrarian Relations in India (PARI) census data, 2006 and 2023.
As overall literacy rate rose, the rise was faster among people from oppressed castes. The literacy rate rose by 23 percentage points among Scheduled Castes and 25 percentage points among Other Backward Classes. Among Other Caste Hindus, the increase was smaller, up to 4 percentage points, as persons in this group had high levels of literacy even in 2006.
Nevertheless, the highest proportion of illiterate persons was among the Scheduled Castes, followed by Other Backward Classes and Other Caste Hindus. The disparity across caste groups narrowed over time, with the greatest improvement observed among Scheduled Caste women (Appendix Table 1). The difference in literacy rate between Other Caste Hindu and Scheduled Caste women was 39 percentage points (27 percentage points for men) in 2006 which fell to 11 percentage points (6 percentage points) in 2023.6
As the socio-economic classification of households in the two villages is not complete, we do not discuss class-wise differences here except to note that literacy was 100 per cent among men belonging to landlord and capitalist farmer households in 2006 itself (and, of course, there was no Scheduled Caste household in this class).7
Disaggregation by age shows that in 2023, illiterate persons were concentrated among older adults, aged 40 and above (Table 2). In particular, literacy rates plummeted among women above the age of 40. In the age cohort 40–50, 66 per cent of women and 15 per cent of men were illiterate. Above the age of 50, 80 per cent of women and 36 per cent of men were illiterate. Further, of all illiterate persons in Mahatwar, 79 per cent were above the age of 40.
Table 2 Proportion of population who cannot read and write, by age group and sex, Mahatwar and Harevli 2023 in percentage
| Age (in years) | Mahatwar | Harevli | ||||
| Female | Male | Persons | Female | Male | Persons | |
| 7–14 | 0 | 5 | 2 | 2 | 5 | 4 |
| 15–25 | 2 | 2 | 2 | 10 | 1 | 5 |
| 26–39 | 25 | 6 | 14 | 26 | 7 | 16 |
| 40–50 | 66 | 15 | 38 | 63 | 20 | 41 |
| >50 | 80 | 36 | 57 | 71 | 28 | 47 |
| All | 28 | 11 | 19 | 30 | 11 | 20 |
Note: There was some illiteracy in the 7–10 age group, but this may have been on account of children enrolled at a later age who were still in the early stages of literacy acquisition.
Source: PARI census data, 2023.
Harevli
In Harevli, the literacy rate was 60 per cent in 2011 (52.2 per cent for females, 67.2 per cent for males). In the PARI surveys, for persons aged 7 and above, the literacy rate was 59 per cent in 2006 and 81 per cent in 2023 (Appendix Table 2). The literacy rate was 50 per cent for females and 65 per cent for males in 2006, which rose to 71 per cent for females and 90 per cent for males in 2023. The only group with 100 per cent literacy in 2006 was men in landlord and capitalist farmer households.
There was an increase in literacy among all social groups, with the change being more pronounced among Scheduled Castes and Muslims. At the same time, the data shows a widening gender gap (from 15 to 19 percentage points) in Harevli. Even as literacy rates for both males and females rose, the rate of improvement was not the same for both (especially among Scheduled Castes and Muslims), exacerbating gender disparities (Table 1).
The literacy divide across caste groups was wider in Harevli as compared to Mahatwar for both men and women. The difference in literacy rates between Scheduled Caste and Other Caste Hindu women was 35 percentage points in 2006, which fell to 28 percentage points in 2023. And among men, the gap reduced from 44 to 9 percentage points.8
There were clear differences across generations. The literacy rate for women above the age of 50 was 29 per cent, as compared to the overall literacy rate of 53 per cent. Of all illiterate women in Harevli village, 71 per cent were above the age of 40. Among men, 76 per cent of illiterate persons were above the age of 40.
In summary, while literacy rates rose over time and were similar across the two villages (slightly higher in Harevli relative to Mahatwar), an interesting difference emerged when the data were disaggregated by gender and caste group. In Mahatwar, the gender gap declined while it rose in Harevli. In Mahatwar, over the 17-year period, the reduction in gender gap was significant among Scheduled Castes. In Harevli, the gender gap rose mainly because of the widening gap between Muslim men and women and Scheduled Caste men and women. In both villages, illiterate persons were concentrated among those above the age of 40, which reflects the absence of adult literacy initiatives in rural Uttar Pradesh.
Years of Schooling
Years of schooling is a useful measure of educational achievement among adults. There has been a remarkable change in years of schooling, especially among women (Tables 3 and 4). In Mahatwar, mean years of schooling for women (16 and above) rose from 3 in 2006 to 8 in 2023; the increase was from 7 to 11 for men. In Harevli, mean years of schooling rose among women from 3 in 2006 to 9 in 2023; the increase was from 6 to 10 for men. These findings are in accordance with observations from the 75th round of the National Sample Survey (NSO 2020): in 2017–18, mean years of completed schooling for persons in rural Uttar Pradesh aged 15 and above was 9.6 years for men and 9.2 years for women.
Table 3 Average completed years of schooling for population aged above 16 years, by social group and sex, Mahatwar, 2006 and 2023 in numbers
| Social group | 2006 | 2023 | ||||
| Female | Male | Persons | Female | Male | Persons | |
| Scheduled Castes | 1 | 6 | 4 | 7 | 10 | 9 |
| Other Backward Classes | 3 | 7 | 5 | 9 | 11 | 10 |
| Other Caste Hindus | 7 | 11 | 9 | 11 | 13 | 12 |
| All | 3 | 7 | 5 | 8 | 11 | 10 |
Source: PARI survey data, 2006, 2023.
Table 4 Average completed years of schooling for population above 16 years, by social group and sex, Harevli, 2006 and 2023 in numbers
| Social group | 2006 | 2023 | ||||
| Female | Male | Persons | Female | Male | Persons | |
| Scheduled Castes | 1 | 3 | 2 | 7 | 10 | 9 |
| Other Backward Classes | 1 | 5 | 3 | 5 | 8 | 7 |
| Other Caste Hindus | 7 | 9 | 8 | 12 | 12 | 12 |
| Muslims | 1 | 2 | 1 | 6 | 7 | 6 |
| All | 3 | 6 | 5 | 9 | 10 | 9 |
Source: PARI survey data, 2006, 2023.
Mahatwar
Despite progress, caste differences persist (Table 3). In 2023, average years of schooling among Scheduled Caste women was seven. All women from Rajput and Brahmin families had attained a minimum of 10 years of schooling.
Next, we examine the number and proportion of graduates, that is persons with a minimum of 15 years of education.
In the total population aged 25 years and above in 2023, there were 134 graduates in Mahatwar. In 2006, there was only one female graduate in Mahatwar, while in 2023, this number increased to 48 – a remarkable change. The number of male graduates was 86 in 2023, up from 27 in 2006. The number of graduates also rose sharply among persons from Scheduled Castes and Other Backward Classes; the latter had no women graduates in 2006 (Appendix Table 3).
The majority of women graduates from the Scheduled Castes were not engaged in paid employment but in household work and animal rearing. Scheduled caste men with graduate degrees were in salaried jobs but also took up non-agricultural work such as construction and borewell digging. Among Other Caste Hindus, women with graduate and post-graduate degrees were mainly engaged in household tasks and animal husbandry.
A clear generational shift in educational attainment was observed in Mahatwar, particularly among women (Figures 1 and 2).9 The older female cohorts had the least years of schooling, while there was an expansion of higher education among the youngest age cohorts. More than 50 per cent of women in the age group 20–29 had completed at least secondary education, which is higher than men in the same age group. Among men, even in the older generation, there were persons with more than 13 years of schooling. Thus, the gender gap has narrowed among the younger cohorts.
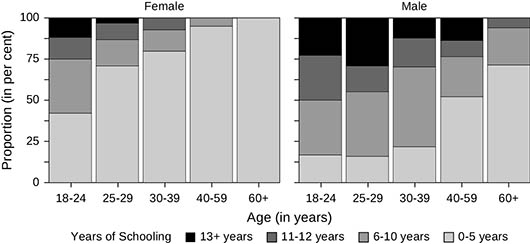
Figure 1 Proportion of completed years of schooling among adults, by age group and sex, Mahatwar, 2006 in per cent
Source: PARI survey data, 2006, 2023.
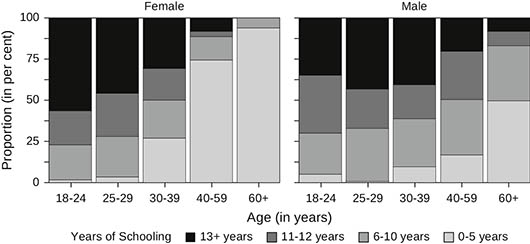
Figure 2 Proportion of completed years of schooling among adults, by age group and sex, Mahatwar, 2023 in per cent
Source: PARI survey data, 2006, 2023.
Harevli
By 2023, overall years of schooling rose though differentially across gender and caste. Other Caste Hindu women were ahead of Scheduled Caste women by five years (the corresponding figure for men was two years). The gap was higher with respect to Muslim women (six years) and Other Backward Class women (seven years). Educational attainment among Scheduled Castes was, on average, higher than that among Other Backward Classes and Muslims, both among men and women (Table 4).
Of the total population aged 25 years and above, in 2023, there were 74 graduates (25 women and 49 men), up from 21 (4 women and 17 men) in 2006 (Appendix Table 4). The number and proportion of graduates rose in all social groups except among Muslims. The highest educational attainment among Muslims in Harevli was 10th grade among men. Among Muslim women in the village, only three had completed more than 10 years of schooling, and all of them were current students.
Among Scheduled Castes, of the two women graduates, one was engaged in housework and another was preparing for competitive exams. Male graduates from Scheduled Caste families were employed in salaried jobs (as teachers, tutors) and also worked on agricultural fields. Of the two women graduates from Other Backward Classes, one was a teacher in Bijnor and another served as a leader of a village self-help group. The number of female graduates in Harevli was lower than in Mahatwar village. Among Other Caste Hindus (Tyagi families), most women graduates had completed their master’s or bachelor’s degrees and were engaged in paid employment as teachers, lecturers or in other salaried jobs. Male graduates from Tyagi families were employed in salaried jobs or engaged in businesses, with only a few participating in cultivation.
In Harevli, a clear generational shift in educational attainment was observed, particularly among women (Figures 3 and 4). While a large share of older women were without formal education, there was a noticeable rise among the youngest age cohorts, with nearly half attaining more than 13 years of schooling.
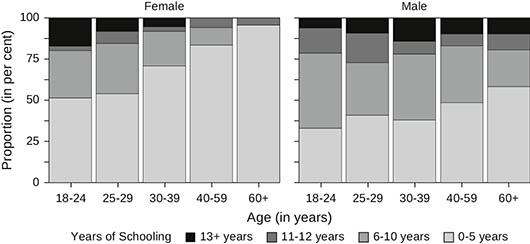
Figure 3 Proportion of completed years of schooling among adults, by age group and sex, Harevli, 2006 in per cent
Source: PARI survey data, 2006, 2023.
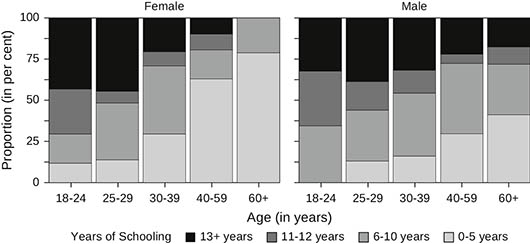
Figure 4 Proportion of completed years of schooling among adults, by age group and sex, Harevli, 2023 in per cent
Source: PARI survey data, 2006 and 2023.
Progress in School Education
Enrolment and Attendance
School attendance showed notable progress in both villages, with near-universal attendance among children in the age group of 7 to 14 years.
Mahatwar
A positive development was that among children aged 7 to 14, there was near-universal school attendance in 2023 in Mahatwar, and though there was some degree of dropout from the age of 15, attendance was over 90 per cent up to the age of 18. In 2023, in Mahatwar, 98.1 per cent of girls and 97.2 per cent of boys aged 7 to 14 attended school. The number of children out of school and at work declined sharply over the years.
There were a few children (some attending and some not attending school) who were engaged in regular economic activity (either for an employer, on their own farm, or in their own family enterprise, such as livestock raising). Some children who attended school regularly also reported engaging in economic activity. Out of the 211 children in the age group 7 to 14 years, only 5 were dropouts, 4 of whom belonged to Scheduled Castes and 1 to Other Backward Classes. Among them, one girl and one boy were engaged in work – one in agricultural labour and the other at a hotel. The remaining three were not working due to some form of disability.
Among those aged 15 to 18, the dropout rate was very high for children from Scheduled Castes and Other Backward Classes. The dropout rate was higher among boys than girls (Appendix Table 4). Young men who dropped out did so to start working in the non-agricultural sector, as a factory worker, carpenter, driver, to take a few examples. This was not the case with young women.
Furthermore, 26 out of 130 students, young boys and girls, were enrolled in educational institutions while working alongside. These students attended nearby schools and colleges such as in Parisiya and Pakwainar villages while also taking up secondary work such as agricultural labour, labour on own farm, borewell digging, and occasional employment under the Mahatma Gandhi National Rural Employment Guarantee Scheme (MGNREGS).
Harevli
In Harevli, too, school attendance among children aged 7 to 14 years was high, with 94.5 per cent of girls and 94.8 per cent of boys attending school in 2023. Of a total of 113 children aged 7 to 14, there were only six dropouts. Of these, one girl was not engaged in any work, while the remaining five (three boys and two girls) were working (four as agricultural labourers and one as a tailor apprentice). These children were from Other Backward Class and Muslim families. There were also children who attended school and engaged in an economic activity: 13 students engaged in farm work alongside their family members.
The dropout rate rose sharply for older children, especially from Scheduled Caste and Muslim families. Less than 50 per cent of young adults from Scheduled Caste and Muslim families, especially girls aged 17 to 18, were in educational institutions. In the age group 15 to 18, the dropout rate was higher among boys than girls. Among school dropouts, young men discontinued their education to enter the workforce, while this was not the case with young women.
A disturbing finding is the prevalence of child labour, especially as workers on the field.10 A group of children (some attending and some not attending school) were engaged in regular economic activity. These children met the demand for seasonal agricultural labour during the sugarcane harvest. From November to March, we found that children were absent from school for 15 or more consecutive days, and worked in the fields, usually with members of their family. This was widely prevalent among children from Jatava households, aged 8 to 15, who were enrolled in the local government primary or middle school. Both boys and girls worked at these agricultural tasks.
Type of School Attended
Enrolment and retention in schools has undoubtedly risen over the last 17 years, but this does not ensure that all individuals receive the same quality of education. We do not have information on outcomes, but data on type of schools can provide some insights into the nature of schooling and costs of basic education. Our main finding here is that the number of children attending private schools, both recognised and unrecognised, has risen sharply; and this tendency increases with age and educational level.
Mahatwar
In Mahatwar, there was one primary school in the village. The nearest town, Pakwainar, is located at a distance of 2 km and Rasra at a distance of 5 km. There were private schools in the nearby villages of Pakwainar, Jakaria, and Rasulpur. The government primary school in the village was a pucca structure with four classrooms. The private missionary schools in the vicinity provided transportation facilities for students residing in and near the village. Additionally, a hostel facility was available for the students enrolled at St. Francis School, Parisiya, including for girls.
According to the Mission Antyodaya survey of 2022–23, the Mahatwar primary school had 139 students enrolled with no reported dropouts, indicating full attendance. The school had basic facilities such as electricity and drinking water, but no playground. In our survey of 2023, of the 416 children attending educational institutions, 173 (42 per cent) were in government or aided institutions and 224 attended private institutions. The proportion of children attending government institutions declined as the level of education (and age of child) rose (Table 5).
Table 5 Children attending school and college, by age group and type of institute, Mahatwar and Harevli, 2023 in numbers
| Age (in years) | Mahatwar | Harevli | ||||
| Government | Private | Total | Government | Private | Total | |
| 7–10 | 70 | 30 | 109 | 30 | 22 | 57 |
| 11–14 | 65 | 29 | 97 | 25 | 23 | 50 |
| 15–19 | 30 | 108 | 143 | 18 | 31 | 52 |
| 20 and above | 8 | 57 | 67 | 10 | 4 | 15 |
| All | 173 | 224 | 416 | 83 | 80 | 174 |
Note: Rasulpur (an adjacent village) was considered to be “within the village” for the analysis here.
The total number may not correspond precisely due to missing or unspecified data.
Source: PARI survey data, 2006, 2023.
The growth of private educational institutions and increasing enrolment in private schools is also reflected in the location of schools and colleges. Young (7–14 years) children attended government school within the village, especially children from Scheduled Caste families. By the age of 15, the same children shifted to private institutions outside the village, within the same district. Meanwhile, the majority of children from Other Caste Hindu families attended private institutions from an early age, and outside the village.
The proliferation of private educational institutions in both villages was accompanied by a growing reliance on private tuitions as a means of academic support for school-going children. We observed that many families paid a fee of Rs 500 per month for tuition classes. The number of children attending these tuitions varied across different caste groups. In Mahatwar, the majority of the children belonging to Scheduled Castes attended tuitions as compared to children from Other Caste Hindu and Other Backward Class families. The dependence on private tuitions is a recent development (not observed in 2006). Further research is needed to understand the cost of education for poorer families.
Harevli
In Harevli village, there was only one primary school (up to grade 5) in 2006. By 2023, a middle school was also established.11 The nearest town is Mandawali, located 4 km away. Secondary and higher secondary schools were situated in Nangal village, Najibabad block, and Mandawali. The primary school had two classrooms, while the middle school had four. The primary school building was an old pucca structure with a veranda, kitchen, and bathroom facilities. Students travelled to nearby villages using three-wheelers, e-rickshaw, and school mini-buses. There were clear caste-wise differences in the type of school attended: only children from Tyagi households attended the Holy Family School, Najibabad, the only private school offering a minibus service.
Overall, in 2023, 174 children attended educational institutions, of whom 83 (48 per cent) were in government or aided institutions and 80 in private institutions (Table 5). In Harevli too, there was an increase in the preference for private educational institutions as well as a growing reliance on private tuitions as a means of academic support for students in the village.
Again, there was disparity across caste groups in children attending private institutions. Among Scheduled Castes and the Other Backward Classes, the majority of young children (aged 7 to 14) attended government institutions, but by the age of 15, they shifted to private institutions. Among Other Caste Hindus, the pattern was different, and an overwhelming majority of children attended private institutions from an early age. Most Muslim children in Harevli continued their education in the village government school till the eighth grade (Appendix Table 5).
Concluding Remarks
Longitudinal data from two villages, based on two rounds of Project on Agrarian Relations (PARI) surveys, 2006 and 2023, offer some insights into progress in education and schooling in rural Uttar Pradesh.
Mahatwar village, located in Ballia district, eastern Uttar Pradesh, is a village where Scheduled Caste households (Jatava and Dusadh) constitute the majority of the population. The major crops grown in the village were paddy and wheat; the income from migrants engaged in the non-agricultural sector as well as that from the non-agricultural sector in the neighbouring region was the major source of income for residents of the village. By contrast, Harevli village, located in Bijnor district, western Uttar Pradesh, lies in the sugarcane belt where agriculture is more dynamic. Incomes from agriculture constituted a significant share of household incomes of residents.
In both villages, there was substantive progress in adult educational attainment and schooling between 2006 and 2023.12 Educational achievements are reflected in terms of the rise in literacy, average years of schooling, and number of graduates. The change was very visible among women. To illustrate, the number of women graduates in Harevli rose from 4 in 2006 to 25 in 2023; the corresponding increase was from 1 to 48 in Mahatwar village.
However, disaggregated data showed observable and large differences in educational attainment across gender, age, caste, and class. The closing of these gaps was dissimilar across the two villages. While Harevli’s aggregate performance was better, progress was slower than Mahatwar in respect of educational attainment among previously deprived groups including women, Scheduled Caste households, and manual workers. For instance, in 2023, the literacy rate among Scheduled Caste women in Mahatwar was 64.9 per cent in 2023 and 58.3 per cent in Harevli. The proportion of 15- to 18-year-old children from Scheduled Caste families attending school was 83 per cent in Mahatwar and 42 per cent in Harevli.
This is an unexpected finding, as the literature on development indicators suggests that western Uttar Pradesh outperforms eastern Uttar Pradesh. A decade ago, in their study of four villages of Uttar Pradesh, one from each of the four regions, Awasthi et al. (2017) found that literacy rates across gender and caste were higher in Seemli village, in the sugarcane belt of western Uttar Pradesh, as compared to Senapur village, located in one of the most backward districts of eastern Uttar Pradesh.
In both villages, the proportion of literate women was below that of men. In Mahatwar, the gender gap in educational attainment narrowed across all caste groups, whereas in Harevli, the gap widened. The gender gap in Mahatwar village was 27 percentage points in 2006, which fell to 21 percentage points in 2023. In Harevli, the gender gap widened from 15 percentage points to 19 percentage points. This arose from the growing gap in literacy among men and women from Scheduled Caste, Other Backward Class, and Muslim households.
Educational attainment among Other Caste Hindu men was considerably ahead of that of men from all other social groups. In terms of socio-economic class, it was the norm for men (and to some extent women) in landlord and capitalist farmer households to be educated, with universal literacy even in 2006. In both Mahatwar and Harevli, members of this class had easy access to private schooling, and continued their education up to the graduate or post-graduate levels.
While the overall literacy rate in both villages increased sharply over the 17 years, universal literacy had not been achieved. Illiteracy was concentrated among the older adults, especially among those aged 50 and above. A total of 57 per cent and 47 per cent of illiterate persons were above the age of 50 in Mahatwar and Harevli respectively. Without expanded adult literacy programmes, universal literacy cannot be attained in these two villages (and in rural areas of Uttar Pradesh) for at least another generation.13
There has been substantial progress in respect of school enrolment and attendance, especially in the age group 7–14; however, dropout rates rise with age (15–18). In this regard, the situation in Harevli village is worrying.
In Mahatwar village, with its relatively low productivity agriculture, most children up to the age of 14 were found to be attending school and not engaged in regular economic activity or work. This reflects both the lack of demand for child labour and the aspirations of parents. Landless Scheduled Caste households, who constituted the majority of the village population, invested in the education of their children, as they visualised their future in non-agricultural employment, particularly outside the village.
In Harevli, school attendance even among younger children (aged 11 to 14) was not 100 per cent and attendance rates dropped sharply after the age of 15 for children from Scheduled Castes and Other Backward Classes. Further, children (boys more than girls) from Scheduled Caste families did not attend school regularly even when they were enrolled, and were absent from school to engage in field labour: of all 6- to 18-year-old boys attending school in Harevli, 17 per cent were also engaged in economic activity.
In Harevli, labour hiring for crop production involved hiring all members of the family including children to work at certain piece-rated tasks such as sugarcane harvesting. Children were sometimes hired on their own for sowing sugarcane. Children were also part of family labour in households cultivating small plots of own or leased in land. Children were involved in many field tasks in paddy, wheat, and sugarcane cultivation. The labour deployment of children is not trivial. To illustrate, in one poor peasant Jatava household operating 3.8 acres (of which 3 acres were leased in), four children between the ages of 7 and 13 were enrolled in school but contributed about one-third of total family labour (101 labour days of a total of 326 family labour days). In this village characterised by commercial agriculture, young boys and girls from landless Dalit families were often engaged in agricultural labour.
In the absence of mechanisation of harvesting, the sugar boom in western Uttar Pradesh may have increased demand for child labour, including for migrant child workers from eastern India.14
Lastly, we noted a steep rise in private schooling, which we know can vary hugely in terms of quality and cost.15 Children from land-owning Caste Hindu families were being sent to private educational institutes from an early age. In both villages, students were more likely to transition to private institutions as they progressed beyond primary education. The majority of children from Dalit families studied in government schools at the primary level, and some shifted to private schools later. This growing shift towards private institutions raises concerns about the cost of basic education borne by poorer families.
In a detailed study of boys and young men from rural Bijnor, Jeffrey et al. (2005) compared the educational strategies of two distinct groups: landed Jat families and landless Jatava families. They identified how Jat families “send sons to the more expensive, well-provisioned, private primary schools and then to privately run junior high school” and so on (p. 2092). Examining the links between patterns of education and occupations, they argued that the “rural elite have privileged access to mainstream schooling and secure salaried employment” (p. 2098). We do not have information on quality of schooling. However, we observed no clear association between the level of educational attainment and occupation/employment.
In conclusion, while we note progress, the persistence of gender, age, and caste gaps in educational attainment, the engagement of children in agricultural labour in the sugarcane belt, and the implications of commercialisation of education for inclusive, quality education and social mobility remain areas of concern.
Acknowledgements: We thank Arindam Das, Sai Chandan Kotu, Ajil Mankunnummal, Kunal Munjal, and C. A. Sethu for their help in preparing the paper. We are grateful to the anonymous referee and Jens Lerche for their valuable comments.
Notes
1 See agrarianstudies.org/research/pari.

2 We have used the sample information for insights into school absenteeism, payment of tuition fees, etc.
3 It is important to note that migrants were included in this study. A migrant is defined as someone who has been away from the village for more than six months during the reference year.
4 Unless otherwise specified, data on literacy refer to persons aged seven and above.
5 This holds true for persons aged 7+ and also 18+.
6 The difference in literacy rate between Other Caste Hindus and Other Backward Classes was 34 percentage points for females and 27 percentage points for males in 2006, which fell to 14 percentage points for females and 11 percentage points for males in 2023.
7 A full discussion of socio-economic classes in the two villages is forthcoming.
8 In 2006, the difference in literacy rate between women of Other Castes and Other Backward Classes was 37 percentage points which fell to 24 percentage points in 2023. The corresponding gap among men fell from 28 to 8.5 percentage points. The gap in literacy rate between Muslims and Other Caste women in 2023 was 34 percentage points in 2006 and fell to 15 percentage points in 2023. The corresponding gap declined from 42 to 0.9 percentage points among men.
9 This follows the format used by Oshikawa and Chakraborty (2023).
10 Child workers were also brought in from Bihar, Jharkhand, and other States, in groups, by contractors for a fixed number of months, which coincided with the sugarcane harvest. This presents a serious problem, but these children could not be covered in our survey.
11 According to Mission Antyodaya survey data (2022–23), Harevli village reportedly had two schools in the village, equipped with all basic facilities but lacking other amenities such as a playground or a computer lab.
12 Progress in education, though uneven across gender and caste, has been noted by many scholars, most recently in the longitudinal study of Palanpur village by Himanshu et al. (2018).
13 For an evaluation of adult literacy programmes in Uttar Pradesh, see Chadha and Wadhwa (2018).
14 We argue that this phenomenon goes beyond children “helping with family chores” including farming, as characterised by Kattumuri and Tiwari (2011) in their study of Palanpur village. They argued, based on data from 2009, that children contributed to agricultural and domestic work, but their work was limited in duration, non-remunerative, and often aligned with school attendance (Kattumuri and Tiwari 2011).
15 Rising privatisation of education was noted by Himanshu et al. in their paper (2018).
References
| Awasthi, I. C., and Shrivastav, P. K. (2017), “Inequalities in Economic and Educational Status Among Social Groups in India: Evidences from a Village-based Study in Uttar Pradesh,” International Journal of Social Economics, vol. 44, no. 6, pp. 774–96.
| |
| Chadha, N., and Wadhwa, S. (2018), “Impact of an Adult Literacy Programme on the Personal and Public Lives of Women: Evidence from India,” Journal of South Asian Development, vol. 30, no. 1, pp. 1–30, available at https://doi.org/10.1177/0973174118764930, viewed on May 24, 2025.
| |
| Ministry of Rural Development (2024), “Mission Antyodaya: Village Survey 2022–23,” Ministry of Rural Development, Government of India, New Delhi, available at https://missionantyodaya.nic.in/, viewed on May 25, 2025.
| |
| Jeffrey, Craig, Jeffery, Patricia, and Jeffery, Roger (2005), “Reproducing Difference? Schooling, Jobs, and Empowerment in Uttar Pradesh, India,” World Development, vol. 33, no. 12, pp. 2085–01, University of Washington and University of Edinburgh.
| |
| Jeffrey, Craig, Jeffery, Patricia, and Jeffery, Roger (2005), “When Schooling Fails: Young Men, Education and Low-caste Politics in Rural North India,” Contributions to Indian Sociology, vol. 39, no. 1, pp. 1–38.
| |
| Kattumuri, R., and Tiwari, D. K. (2011), “Developments in Education in Palanpur, a Village in Uttar Pradesh,” Asia Research Centre working paper no. 49, London School of Economics and Political Science, London.
| |
| Lanjouw, Peter, and Stern, Nicholas (2018), “Human Development: Education, Health and Public Services,” in Lanjouw, Peter, and Stern, Nicholas (eds.), How Lives Change: Palanpur, India, and Development Economics, Oxford University Press.
| |
| National Statistical Office (2020), Household Social Consumption on Education in India: NSS 75th Round (July 2017–June 2018), Ministry of Statistics and Programme Implementation, Government of India, New Delhi, available at https://mospi.gov.in/sites/default/files/publication_reports/Report_585_75th_round_Education_final_1507_0.pdf, viewed on February 7, 2025.
| |
| Oshikawa, Fumiko, and Chakraborty, Sanjukta (2022), “Schooling and Literacy in Two Bihar Villages,” Review of Agrarian Studies, vol. 12, no. 1, available at https://doi.org/10.25003/RAS.12.01.0009, viewed on January 20, 2025.
| |
| Oshikawa, F., and Chakraborty, S. (2023), “Education,” in Swaminathan, M., Surjit, V., and Ramachandran, V. K. (eds.), Economic Change in the Lower Cauvery Delta: A Study of Palakurichi and Venmani, Tulika Books, New Delhi.
| |
| Ramachandran, V. K., Rawal, V., and Swaminathan, M. (eds.) (2010), “Literacy and Schooling,” in Socio-Economic Surveys of Three Villages in Andhra Pradesh: A Study of Agrarian Relations, Tulika Books and Foundation for Agrarian Studies, pp. 158–76.
|
Appendix
Appendix Table 1 Proportion of population (aged 7 and above) which can read and write, by social group and sex, Mahatwar, 2006 and 2023 in per cent
| Social group | 2006 | 2023 | ||||
| Female | Male | Persons | Female | Male | Persons | |
| Scheduled Castes (SC) | 37 | 68 | 53 | 65 | 86 | 76 |
| Other Backward Castes (OBC) | 42 | 69 | 55 | 68 | 90 | 80 |
| Other Caste Hindus (OC) | 76 | 95 | 85 | 79 | 97 | 89 |
| All | 43 | 70 | 57 | 67 | 88 | 78 |
Source: PARI census survey data, 2006 and 2023.
Appendix Table 2 Proportion of population (7 years and above) which can read and write, by social group and sex, Harevli, 2006 and 2023 in per cent
| Social group | 2006 | 2023 | ||||
| Female | Male | Persons | Female | Male | Persons | |
| Scheduled Castes | 40 | 46 | 44 | 58 | 86 | 73 |
| Other Backward Castes | 38 | 62 | 51 | 63 | 86 | 74 |
| Other Caste Hindus | 75 | 90 | 84 | 87 | 94 | 91 |
| Muslims | 41 | 48 | 44 | 71 | 94 | 83 |
| All | 50 | 65 | 58 | 70 | 89 | 80 |
Source: PARI census survey data, 2006 and 2023.
Appendix Table 3 Number of graduates in the age group of 25 years and above, by social group and sex, Mahatwar and Harevli, 2006 and 2023
| Social group | Mahatwar | Harevli | ||||||
| 2006 | 2023 | 2006 | 2023 | |||||
| Female | Male | Female | Male | Female | Male | Female | Male | |
| Scheduled Castes | 0 | 10 | 19 | 37 | 0 | 2 | 2 | 10 |
| Other Backward Classes | 0 | 7 | 17 | 27 | 0 | 0 | 2 | 4 |
| Other Caste Hindus | 1 | 10 | 12 | 22 | 4 | 15 | 21 | 35 |
| Muslims | - | - | - | - | 0 | 0 | 0 | 0 |
| All | 1 | 27 | 48 | 86 | 4 | 17 | 25 | 49 |
Source: PARI census survey data, 2006 and 2023.
Appendix Table 4 Proportion of children attending school, by age group and social group, Mahatwar and Harevli, 2023 in per cent
| Age group (in years) | Mahatwar | Harevli | |||||
| Scheduled Castes | Other Backward Classes | Other Castes | Scheduled Castes | Other Backward Classes | Other Caste Hindus | Muslims | |
| 6–10 | 99 | 96 | 100 | 100 | 97 | 95 | 100 |
| 11–14 | 95 | 100 | 100 | 100 | 87 | 100 | 63 |
| 15–16 | 96 | 89 | 100 | 50 | 62 | 100 | 60 |
| 17–18 | 72 | 80 | 100 | 38 | 83 | 83 | 13 |
| 6–18 | 91 | 92 | 100 | 75 | 86 | 95.7 | 54 |
Source: PARI survey data, 2023.
Appendix Table 5 Children attending school, by age group, type, and location of school, Mahatwar and Harevli, 2023 in numbers
| Type of school and location | Age groups (in years) | |||||
| Mahatwar | Harevli | |||||
| 7–10 | 11–14 | 15–18 | 7–10 | 11–14 | 15–18 | |
| Government school, within village | 65 | 57 | 14 | 29 | 23 | 0 |
| Government school, within district | 4 | 6 | 13 | 0 | 0 | 0 |
| Government school, within state | 1 | 2 | 4 | 1 | 2 | 16 |
| Private school, within village | 7 | 3 | 0 | 0 | 0 | 0 |
| Private school, within district | 19 | 23 | 89 | 2 | 0 | 1 |
| Private school, within state | 3 | 3 | 3 | 22 | 25 | 28 |
Note: The table does not match the total number of school-going students, as it does not include the number of students studying outside the State and a few unreported data.
Source: PARI survey data, 2023.
Date of submission of manuscript: March 15, 2025
Date of acceptance for publication: May 31, 2025