

ARCHIVE
Vol. 15, No. 2
JULY-DECEMBER, 2025
Editorial
Research Articles
Referees
Land and Income Mobility in Two North Indian Villages: A Note
*
†
https://doi.org/10.25003/RAS.15.02.0009
Abstract: This paper examines household-level mobility in land ownership and incomes over a 17-year period (2006–2023) in two villages of Uttar Pradesh—Mahatwar in Ballia district and Harevli in Bijnor district—based on panel data from the Foundation for Agrarian Studies’ Project on Agrarian Relations in India. Results show that mobility in land ownership was low in both villages, reflecting persistent agrarian inequality: about three-fourths of households remained in the same landholding class. However, some landless Scheduled Caste households acquired small plots through non-agricultural earnings and remittances, while a few large landowners experienced downward mobility due to division or sale of land. Income mobility, by contrast, was higher, driven by diversification into non-farm employment and migration. The findings reveal a widening disconnect between land-based and income-based mobility, highlighting that while income growth has improved living standards, land concentration and caste-linked disadvantage remain enduring features of rural Uttar Pradesh.
Keywords: land ownership mobility, income mobility, Uttar Pradesh villages, rural inequality, non-farm employment, remittances, caste, agrarian structure
Introduction
This paper draws on panel data from two rounds of surveys of Mahatwar and Harevli villages in Uttar Pradesh to examine patterns of household mobility in respect of land ownership and incomes over a 17-year period. The analysis offers insights into how aggregate economic change translates into change at the household level, specifically with regard to the nature of upward and downward economic mobility.
Data
The Foundation for Agrarian Studies (FAS) conducted census surveys in two villages of Uttar Pradesh in 2006 as part of its village studies programme titled “Project on Agrarian Relations in India” (PARI).1 The villages, Mahatwar in Ballia district of eastern Uttar Pradesh and Harevli in Bijnor district of western Uttar Pradesh, were resurveyed using a similar methodology in June 2023. Using these two rounds, we constructed household panels.
Mahatwar
Mahatwar is located in Rasra tehsil of Ballia district, just off the Ballia-Mau highway. In 2006, a census survey covered all 156 households in the village. In June 2023, as part of the resurvey, a household questionnaire capturing demographic features as well as land and asset holdings was first completed for all resident households. The total number of households was 217 in 2023. To collect detailed data on employment, wealth, income, and credit, a stratified random sample was chosen with caste as the primary variable for stratification, followed by substrata based on land ownership. A detailed questionnaire, same as in 2006, was canvassed for the sample of 109 households (about 50 per cent of all households).2 Data on incomes and wealth were derived from the sample survey, and weights were used for population estimates, where relevant.
Two distinct panels were constructed for mobility analysis in Mahatwar. The first panel was based on the census rounds in the two years, and was used to study changes in land ownership. The second panel was based on the sample survey of 2023 and was used to examine income mobility.
Panel 1
Of 156 resident households in the village in 2006, we identified 118 common/parent households in 2023. Of the 217 resident households in 2023, 155 were included in the panel. A household was included in the panel if the head of household/spouse was the same as in 2006 or was a direct descendant of the household head recorded in 2006. For example, if a couple had a young son in 2006, and in 2023, there were two families that of the couple and the son, both were included in the panel, with the latter defined as the satellite or offshoot household. To ensure comparability over time, the data on satellite households were combined with the original parent households (e.g., the land owned by the son was added to that owned by the father). The attrition was 24 per cent.3
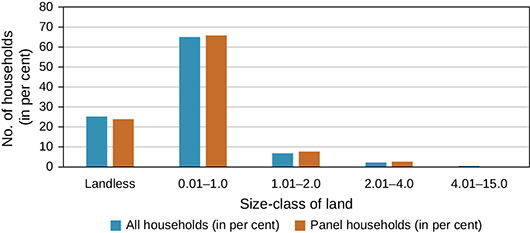
We examined the caste composition in the census data from the two rounds (longitudinal data and panel data), and found no major discrepancies (Table 1). In line with the change in the caste composition of the village, the panel had a slightly higher proportion of Scheduled Castes and a lower proportion of Other Backward Classes than the 2006 survey (Table 2). Appendix Figures 1 and 2 indicate that the distribution of households by extent of land owned in the panel did not differ from the village population in both years.
Table 1 Distribution of households in panel data and longitudinal survey data, by caste, Mahatwar, 2006 and 2023 in numbers and per cent
| Year | No. of HHs | Scheduled Castes | Other Backward Classes | Other Caste Hindus | |||
| Total | (%) | Total | (%) | Total | (%) | ||
| 2006 – All HHs | 156 | 95 | 61 | 48 | 31 | 13 | 8 |
| 2006 – Panel HHs | 118 | 74 | 63 | 34 | 29 | 10 | 8 |
| 2023 – All HHs | 217 | 136 | 63 | 62 | 28 | 19 | 9 |
| 2023 – Panel HHs | 155 | 99 | 64 | 43 | 28 | 13 | 8 |
Note: HHs stands for households.
Source: Project on Agrarian Relations in India (PARI) data, 2006 and 2023.
Table 2 Distribution of households in panel data and longitudinal survey data, by caste, Mahatwar, 2006 and 2023 in numbers and per cent
| Year | No. of HHs | Scheduled Castes | Other Backward Classes | Other Caste Hindus | |||
| Total | (%) | Total | (%) | Total | (%) | ||
| 2006 – All HHs | 156 | 95 | 61 | 48 | 31 | 13 | 8 |
| 2006 –Panel HHs | 74 | 50 | 67 | 16 | 22 | 8 | 11 |
| 2023 – All HHs | 217 | 136 | 63 | 62 | 28 | 19 | 9 |
| 2023 – Panel HHs | 83 | 55 | 66 | 19 | 23 | 9 | 11 |
Note: HHs stands for households.
Source: PARI data, 2006 and 2023.
Panel 2
With information on income and wealth for the sample households in 2023, we constructed another panel. Of the 109 sample households in 2023, 83 were included in the panel, corresponding to 74 parent households in 2006. The second panel has an over-representation of Scheduled Castes relative to the village in both years (66 per cent versus 62 per cent).
Harevli
Harevli is located in Najibabad tehsil of Bijnor district in western Uttar Pradesh. When the census survey was conducted in 2006, the village had a total of 109 households belonging to different caste groups. This is a multi-caste village with Scheduled Caste, Other Backward Class, Muslim, and Other Caste Hindu households. In the census survey of 2023, 129 households were recorded. The increase in households was mainly due to splitting of parent households into satellite households by 2023, and three new households reported in 2023 that were not part of the 2006 survey.
Panel
In 2006, there were 109 resident households in the village, of whom 87 households were identified as common or parent households. Of the 129 households in 2023, 115 households were included in the panel. Attrition was about 22.3 per cent. As mentioned earlier, a household was included in the panel if the head of household/spouse was the same as in 2006 or was a direct descendant of the household head in 2006.
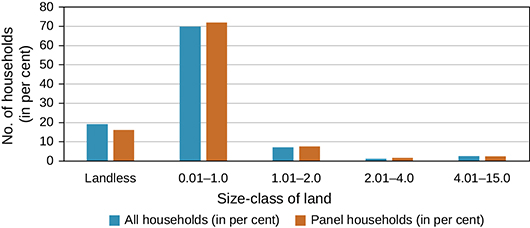
There were small discrepancies between the panel and longitudinal data in respect of caste composition. The panel had a lower representation of Muslim households than in the 2006 survey (Table 3). Appendix Figures 3 and 4 show the distribution of households by extent of crop land owned, and there is a slight underrepresentation of landless households and overrepresentation of medium and large landowning households in the panel relative to the two cross-section surveys.
Table 3 Distribution of households in panel data and longitudinal survey data by caste, Harevli, 2006 and 2023 in numbers and per cent
| Year | No. of HHs | Scheduled Castes | Other Backward Classes | Other Caste Hindus | Muslims | ||||
| Total | (%) | Total | (%) | Total | (%) | Total | (%) | ||
| 2006 – All HH | 109 | 41 | 38 | 23 | 21 | 32 | 29 | 13 | 12 |
| 2006 –Panel HH | 87 | 32 | 37 | 20 | 23 | 29 | 33 | 6 | 7 |
| 2023 – All HH | 129 | 41 | 32 | 43 | 33 | 36 | 28 | 9 | 7 |
| 2023 – Panel HH | 115 | 40 | 35 | 36 | 31 | 33 | 29 | 6 | 5 |
Note: HHs stands for households.
Source: PARI data, 2006 and 2023.
Methodology
Variables
In our study, land refers to agricultural or crop land alone and is measured by extent, not value.
Household income is derived from income from crop production, animal resources, agricultural and non-agricultural wage labour, salaries and business and trade, rent, interest, pension, remittances, scholarship, and other sources. All income is net of costs incurred by the households. The reference period for income were the agricultural years (2006–07 and 2022–23 respectively). To adjust for changes in household size over time, the variable chosen was per capita household income. For comparison in real terms, per capita incomes from 2006 were converted to 2023 prices using the Consumer Price Index for Agricultural Labourers (CPI-AL).
We must note a couple of caveats at this juncture. Land is a stock variable and relatively stable over time. Income is a flow variable, varies from year to year, and is not a good measure of a household’s long-term economic status. Further, we are confident of the quality of data on land ownership, but incomes of the rich are underestimated as it was difficult to measure incomes generated outside the village, such as from financial assets, real estate, or other businesses.
Matrix Measures
A matrix of mobility is a matrix of transition probabilities where mij refers to the probability of a household in the ith class in period t-1 moving to the jth class in period t. Mobility can be measured using both cell-specific and aggregate measures. Trace and Distance measures were used to assess the degree of aggregate mobility. The Trace measure can be defined as:
The Trace measure takes account of only the diagonal terms, and provides a quick measure of mobility. The Distance measure captures the extent of mobility in terms of distance moved from the diagonal, and is defined as:
where the maximum value =  for odd n. This measure ranges from zero to one, with zero termed as perfect immobility (Swaminathan 1991).
Mobility in Ownership of Land
Mahatwar
Based on Panel 1, we examined mobility in ownership of land, grouped by size-class, in absolute numbers (Table 4) and proportions (Table 5). The diagonal elements represent households that remained in the same size-class of land holding in both years. The off-diagonal elements represent households that moved to different land ownership classes.
Table 4 Distribution of households by ownership of crop land, by size-class, Mahatwar, 2006 and 2023 in numbers
| Size-class of land holding (in hectares) 2006 | Size-class of land holding (in hectares) 2023 | |||||
| Landless | 0.01–1.0 | 1.01–2.0 | 2.01–4.0 | 4.01–15.0 | Total | |
| Landless | 7 | 12 | 0 | 0 | 0 | 19 |
| 0.01–1.0 | 8 | 74 | 3 | 0 | 0 | 85 |
| 1.01–2.0 | 0 | 3 | 6 | 0 | 0 | 9 |
| 2.01–4.0 | 0 | 0 | 1 | 1 | 0 | 2 |
| 4.01–15.0 | 0 | 0 | 1 | 0 | 2 | 3 |
| Total | 15 | 89 | 11 | 1 | 2 | 118 |
Note: Diagonal terms are in bold. The above matrix was calculated based on Panel 1 of Mahatwar.
Source: PARI survey data, 2006 and 2023.
Table 5 Mobility matrix for households ranked by ownership of crop land, by size-class, Mahatwar, 2006 and 2023
| Size-class of land holding (in hectares) 2006 | Size-class of land holding (in hectares) 2023 | ||||
| Landless | 0.01–1.0 | 1.01–2.0 | 2.01–4.0 | 4.01–15.0 | |
| Landless | 0.37 | 0.63 | 0 | 0 | 0 |
| 0.01–1.0 | 0.09 | 0.87 | 0.04 | 0 | 0 |
| 1.01–2.0 | 0 | 0.33 | 0.67 | 0 | 0 |
| 2.01–4.0 | 0 | 0 | 0.5 | 0.5 | 0 |
| 4.01–15.0 | 0 | 0 | 0.33 | 0 | 0.67 |
Notes: Diagonal terms are in bold. The above matrix is calculated based on Panel 1 of Mahatwar.
Source: PARI survey data, 2006 and 2023.
Table 4 can be understood as follows. Of 19 landless households in 2006, 7 remained landless in 2023 but 12 acquired land and moved to the category of marginal land owners (less than 1 ha). The transition matrix, in Table 5, represents the same information as follows: 37 per cent of households remained landless in both years while 63 per cent gained land and showed upward mobility. In Mahatwar, all households that were landless in 2006 belonged to the Scheduled Castes.
We discuss two cases of upward mobility here. The head of a Scheduled Caste household owned a village shop and his son was a school bus driver at St Mary’s School, Raghavpur. Financed by trade and non-agricultural labour earnings, this household purchased 0.26 ha of land in two transactions in 2009 from a Thakur household in Nawpura village. Another Scheduled Caste household purchased 0.59 ha of crop land in 2009 from a Thakur family of Rasulpur village. This purchase was funded by remittances from two sons who had migrated to cities for work (one son was employed in a factory in Haryana and another worked in Hyderabad).
At the other end of the distribution, of three households with landholding size 4–15 ha, landholding for one household fell from 13.49 ha to 1.89 ha, after land was divided between three brothers, only one of whom now resides in the village.
Overall, the degree of mobility in land ownership was low (Table 6). Of all households, 13 per cent exhibited upward mobility, 11 per cent showed downward mobility, and 76 per cent remained in the same category. The Trace measure was 0.48 and the Distance measure was extremely low at 0.044. In other words, even when there was mobility, the extent of mobility was limited.
Table 6 Measures of land mobility, Mahatwar, 2006 and 2023 in numbers and per cent
| Measure | |
| Distance measure | 0.044 |
| Trace measure | 0.48 |
| Upward mobility (%) | 13 |
| Downward mobility (%) | 11 |
| Stability (%) | 76 |
Harevli
Turning to Harevli, of 26 landless households in 2006, 16 households (11 from the Scheduled Castes and four from Other Backward Classes) shifted from a status of landlessness to becoming owners of tiny plots of land (Table 7) in 2023. In proportionate terms, 38 per cent remained landless and 62 per cent experienced some upward mobility (Table 8). Overall, 22 per cent of households experienced upward mobility by gaining land.4
Table 7 Distribution of households by ownership of crop land, by size-class, Harevli, 2006 and 2023 in numbers
| Size-class of land holding (in hectares) 2006 | Size-class of land holding (in hectares) 2023 | |||||
| Landless | 0.01–1.0 | 1.01–2.0 | 2.01–4.0 | 4.01–15.0 | Total | |
| Landless | 10 | 16 | 0 | 0 | 0 | 26 |
| 0.01–1.0 | 6 | 24 | 0 | 1 | 0 | 31 |
| 1.01–2.0 | 0 | 0 | 4 | 3 | 0 | 7 |
| 2.01–4.0 | 0 | 1 | 3 | 8 | 0 | 12 |
| 4.01–15.0 | 0 | 1 | 1 | 1 | 8 | 11 |
| Total | 16 | 42 | 8 | 13 | 8 | 87 |
Note: Diagonal terms are in bold.
Source: PARI data, 2006 and 2023.
Table 8 Mobility matrix for households ranked by ownership of crop land, by size-class, Harevli, 2006 and 2023
| Size-class of land holding (in hectares) 2006 | Size-class of land holding (in hectares) 2023 | ||||
| Landless | 0.01–1.0 | 1.01–2.0 | 2.01–4.0 | 4.01–15.0 | |
| Landless | 0.38 | 0.62 | 0 | 0 | 0 |
| 0.01–1.0 | 0.19 | 0.77 | 0 | 0.03 | 0 |
| 1.01–2.0 | 0 | 0 | 0.57 | 0.43 | 0 |
| 2.01–4.0 | 0 | 0.08 | 0.25 | 0.67 | 0 |
| 4.01–15.0 | 0 | 0.09 | 0.09 | 0.09 | 0.73 |
Note: Diagonal terms are in bold.
Source: PARI data, 2006 and 2023.
Downward mobility was evident among four households owning 2–4 ha and three households owning 4–15 ha of land. Many reasons were reported for sale of land by these households including to pay for the expenses of a marriage, medical expenses, construction of a better house, and out-migration. To illustrate, a Tyagi farmer sold 0.8 ha of land to cover the expenses of his daughter’s marriage.
Overall, the land ownership matrix reveals low mobility (Table 9). The Trace measure was 0.47 and the Distance measure equalled 0.048. The low value of the Distance measure indicates that even when households lost or gained land, the distance moved was not large. Nevertheless, the aggregate degree of mobility in the panel for Harevli was slightly higher than that observed in Panel 1 for Mahatwar.
Table 9 Measures of land mobility, Harevli, 2006 and 2023 in numbers and per cent
| Measure | |
| Distance measure | 0.048 |
| Trace measure | 0.47 |
| Upward mobility (%) | 22 |
| Downward mobility (%) | 14 |
| Stability (%) | 63 |
Income Mobility
Mahatwar
In Mahatwar, the analysis of income mobility was based on quintiles of per capita household income, as shown in Table 10. The median, range, and standard deviation of incomes in each quintile are shown in Table 11. It is clear that the median income in each quintile rose three-fold over the survey years. This is in line with the observation by Arindam Das et al. (2024) that household incomes grew at a compound annual growth rate (CAGR) of 5.2 per cent in Mahatwar between 2006 and 2023. Note that the range and standard deviation were highest in Q5.
Table 10 Distribution of households by real per capita income, in quintiles, Mahatwar, 2006 and 2023 in numbers
| Per capita income quintiles 2006 | Per capita income quintiles 2023 | |||||
| Q1 | Q2 | Q3 | Q4 | Q5 | Total | |
| Q1 | 2 | 5 | 4 | 3 | 1 | 15 |
| Q2 | 2 | 4 | 4 | 3 | 2 | 15 |
| Q3 | 4 | 1 | 3 | 3 | 3 | 14 |
| Q4 | 5 | 4 | 1 | 2 | 3 | 15 |
| Q5 | 2 | 1 | 2 | 4 | 6 | 15 |
| Total | 15 | 15 | 14 | 15 | 15 | 74 |
Notes: Diagonal terms are in bold. The above matrix was calculated based on Panel 2 of Mahatwar.
Source: PARI data, 2006 and 2023.
Table 11 Distribution of real per capita household incomes, by range, median, and standard deviation, in quintiles, Mahatwar, 2006 and 2023 in rupees at constant prices
| Year | 2006 | 2023 | ||||
| Quintiles | Range | Median | Standard deviation | Range | Median | Standard deviation |
| Q1 | 2311–5522 | 4018 | 940 | 262–19040 | 17365 | 5025 |
| Q2 | 5523–9182 | 6860 | 1180 | 19041–32696 | 25894 | 4440 |
| Q3 | 9183–11700 | 10019 | 820 | 32697–51230 | 39373.5 | 4736 |
| Q4 | 11701–21913 | 16418 | 2755 | 51231–84294 | 65356 | 10353 |
| Q5 | 21914–138145 | 30669 | 30641 | 84295–315959 | 97413 | 65877 |
Note: Incomes in 2006 were converted into 2023 prices using the Consumer Price Index for Agricultural Labourers (CPI-AL).
In the income matrix, in all quintiles, the diagonal term was less than 0.5, indicating that more than 50 per cent of households in any quintile moved to a different quintile over the 17-year period (Table 12). Only 23 per cent of households remained in the same quintile in both years. Moreover, even those who remained in the same quintile experienced an absolute rise in incomes. Of 74 households in the panel, 65 experienced a rise in absolute incomes and only 8 experienced a decline in absolute incomes.5
Table 12 Mobility matrix for households ranked by real per capita income, in quintiles, Mahatwar, 2006 and 2023
| Per capita income quintiles 2006 | Per capita income quintiles 2023 | ||||
| Q1 | Q2 | Q3 | Q4 | Q5 | |
| Q1 | 0.13 | 0.33 | 0.27 | 0.2 | 0.07 |
| Q2 | 0.13 | 0.27 | 0.27 | 0.2 | 0.13 |
| Q3 | 0.29 | 0.07 | 0.21 | 0.21 | 0.21 |
| Q4 | 0.33 | 0.27 | 0.07 | 0.13 | 0.2 |
| Q5 | 0.13 | 0.07 | 0.13 | 0.27 | 0.4 |
Notes: Diagonal terms are in bold. The above matrix is calculated based on Panel 2 of Mahatwar.
Source: PARI data, 2006 and 2023.
Turning to patterns of mobility, there was significant upward mobility among households in Q1 and Q2 (of 22 households that moved up from Q1, 12 belonged to the Scheduled Castes and 5 belonged to Other Backward Classes). For example, one Scheduled Caste household shifted from Q2 to Q5 in terms of per capita income on account of remittances received from a son (engaged in a salaried private sector job with a steel company in Delhi). Another household experienced upward mobility on account of rise in remittances from family members (who worked for a tractor company in Faridabad), along with earnings from business and trade activities.
The growth of incomes of households showing upward mobility derived primarily from diversification of employment and growing share of non-farm income in household income. The proportion of farm income in total income fell across all quintiles: the share of crop and animal resources in total income fell from 23 per cent in 2006 to 8 per cent in 2023 (Dhar and Singh 2025, this issue). Income growth in Mahatwar village was driven by non-farm employment such as in bore-well digging, construction, plumbing, carpentry, and welding (see Das et al. 2024).
In terms of per capita income, the Distance measure was 0.254 and the Trace measure was 0.96, indicating that the majority of households moved off the diagonal between 2006 and 2023 (Table 13). In Mahatwar, 42 per cent of households exhibited upward mobility.
Table 13 Measures of per capita income mobility, Mahatwar, 2006 and 2023 in numbers and per cent
| Measure | |
| Distance measure | 0.254 |
| Trace measure | 0.96 |
| Upward mobility (%) | 42 |
| Downward mobility (%) | 35 |
| Stability (%) | 23 |
Harevli
Relative mobility in household incomes in Harevli is shown in Tables 14 and 16, and Table 15 shows quintile-wise median, standard deviation, and range of incomes. The median incomes of each quintile rose threefold between 2006 and 2023, except for Q5 where incomes rose two-fold.6 Note that incomes in Q5 are likely to have been underestimated.
Table 14 Distribution of households by real per capita income, in quintiles, Harevli, 2006 and 2023 in numbers
| Per capita income quintiles 2006 | Per capita income quintiles 2023 | |||||
| Q1 | Q2 | Q3 | Q4 | Q5 | Total | |
| Q1 | 9 | 4 | 2 | 1 | 2 | 18 |
| Q2 | 3 | 4 | 7 | 2 | 1 | 17 |
| Q3 | 3 | 7 | 3 | 4 | 0 | 17 |
| Q4 | 2 | 1 | 4 | 6 | 4 | 17 |
| Q5 | 1 | 1 | 1 | 4 | 11 | 18 |
| Total | 18 | 17 | 17 | 17 | 18 | 87 |
Note: Diagonal terms are in bold.
Source: PARI data, 2006 and 2023.
Table 15 Distribution of real per capita household incomes, by range, median, and standard deviation, in quintiles, Harevli, 2006 and 2023 in rupees at constant prices
| Year | 2006 | 2023 | ||||
| Quintiles | Range | Median | Standard deviation | Range | Median | Standard deviation |
| Q1 | (-1952)–7495 | 4638 | 2456 | 1430–23354 | 16512 | 6735 |
| Q2 | 7496–11537 | 9909 | 1394 | 23355–48082 | 34925 | 6842 |
| Q3 | 11538–19704 | 15365 | 2332 | 48083–79391 | 61039 | 9010 |
| Q4 | 19705–46217 | 26280 | 6669 | 79392–144093 | 92704 | 13534 |
| Q5 | 46218–385019 | 99023 | 102295 | 144094–598261 | 190419 | 149210 |
Note: Incomes in 2006 were converted into 2023 prices using the Consumer Price Index for Agricultural Labourers (CPI-AL).
Of the 87 households in the panel, 77 experienced an absolute rise in per capita incomes while 10 experienced a fall in income.7
From the transition matrix, Table 16, it can be observed that 61 per cent of households that belonged to the highest income quintile in 2006 remained in the same quintile in 2023 while 39 per cent moved to lower quintiles. To illustrate, consider the case of downward mobility of a Muslim household that moved from Q5 in 2006 to Q1 in 2023. In 2006, two sons were outside the village (one worked as a barber in Delhi and the other as a car mechanic in Chandigarh) and sent remittances. In 2023, the elder son had returned to the village after the death of his father, and lost his remunerative job.
Table 16 Mobility matrix for households ranked by real per capita income, in quintiles, Harevli, 2006 and 2023
| Per capita income quintiles 2006 | Per capita income quintiles 2023 | ||||
| Q1 | Q2 | Q3 | Q4 | Q5 | |
| Q1 | 0.5 | 0.22 | 0.11 | 0.06 | 0.11 |
| Q2 | 0.18 | 0.23 | 0.41 | 0.12 | 0.06 |
| Q3 | 0.18 | 0.41 | 0.18 | 0.23 | 0 |
| Q4 | 0.12 | 0.06 | 0.24 | 0.35 | 0.23 |
| Q5 | 0.06 | 0.06 | 0.05 | 0.22 | 0.61 |
Note: Diagonal terms are in bold.
Source: PARI data, 2006 and 2023.
Half of the households in Q1 in 2006 remained in Q1 in 2023 while the other half experienced upward mobility. The main factors for upward mobility were migration, increased remittances, and expansion of non-agricultural incomes. A big change was experienced by a Jatava household, which shifted from Q1 to Q5 when the household head obtained a salaried job as a cleaner in the government sector.
The Distance measure was 0.146 and the Trace measure was 0.78 for the per capita income matrix (Table 17). Of all households, 31 per cent showed downward mobility while another 31 per cent exhibited upward mobility. In aggregate, the mobility in the household’s real per capita income was higher in Mahatwar (only 23 per cent of total households showed stability) when compared with Harevli (as 38 per cent of total households ranked in the same quintile in both years).
Table 17 Measures of per capita income mobility, Harevli, 2006 and 2023 in numbers and per cent
| Measure | |
| Distance measure | 0.146 |
| Trace measure | 0.78 |
| Upward mobility (%) | 31 |
| Downward mobility (%) | 31 |
| Stability (%) | 38 |
Concluding Remarks
Using panel data from two villages of Uttar Pradesh, Mahatwar and Harevli, for the period 2006–2023, we examined patterns of mobility in respect of ownership of agricultural land and per capita household income. In our view, estimates of income were not very accurate for the rich, but estimates of land owned were reliable for all households.
In both villages, the concentration of ownership of land was very high: the top 5 per cent of households owned 40 per cent of the total land in both villages in 2006 (Swaminathan 2022). In 2023, the share of total land owned by the top 5 per cent was 35 per cent in Mahatwar and 34 per cent in Harevli. In Mahatwar, aggregate inequality in land ownership as measured by the Gini coefficient barely changed over time: it was 0.744 in 2006 and 0.737 in 2023. In Harevli, there was a marginal fall in the Gini coefficient, from 0.766 to 0.714.
Given this context, it was no surprise that aggregate household mobility in respect of agricultural land was very low and similar across the two villages. Nevertheless, some landless households gained land while some big landowners lost land. This pattern of change reflects two phenomena: (i) a generational change as children of the landed rich moved to cities and out of farming, and (ii) the purchase of tiny plots of land by the landless and land-poor from savings generated by non-agricultural earnings including from migration and remittances.
This pattern of change is similar to observations in Rodgers et al. (2016), based on a study of 36 villages in Bihar between 1998 and 2010. They found a tendency for downward mobility among big landowners, which was mainly because of population growth and the continued division of small land plots. In contrast, there was some increase in land ownership, particularly among marginal farmers, while the proportion of landless households remained relatively constant. Srivastava also noted that land held by Brahmin landowners in Belapur, a village in eastern Uttar Pradesh, declined between 1994 and 2012, reflected in small changes in land owned by Other Backward Class and Scheduled Caste households (Srivastava 2016). In Palanpur village, between 1957–58 and 2008–09, as Himanshu, Lanjouw, and Stern (2018) noted, “There is a clear and strong trend towards marginalisation in the distribution of ownership holdings in Palanpur, with a little over two-thirds of households being marginal in 2008–09” (p. 61). They attributed this to population pressure and division of land holdings. In 2023, households with marginal land holdings accounted for 70 per cent of all households in Harevli and 65 per cent in Mahatwar.
Relative income mobility was higher than mobility in land holdings. This is not surprising given that income is a flow variable and less stable than a stock variable such as land. We must caution again that incomes of the rich were underestimated as it was difficult to measure incomes generated outside the village, such as from financial assets or real estate. Nevertheless, there was significant movement of panel households from one quintile to another except among the top income groups.
The disjuncture between low mobility in land ownership and higher mobility in incomes reflects the fact of income growth driven by non-agricultural sources of earnings.8
The major longitudinal village study in Uttar Pradesh is that of Palanpur village in western Uttar Pradesh. Panel data for Palanpur show that the share of the households ranked in the same income quintiles for the two survey rounds was 28 per cent for the period 1957–62, and fell to 20 per cent for the period 1983–2009, suggesting rising income mobility over the decades. In the most recent panel of 107 households for the years 1983 to 2009, a 25-year period, only 8 per cent of the households in Palanpur remained in Q1 in both years and 20 per cent remained in Q5.
Overall, the data from the PARI villages suggest lower mobility in incomes. In Mahatwar village, 13 per cent of the households stayed in Q1 between 2006 and 2023 whereas 40 per cent remained in Q5. In Harevli, 50 per cent of households remained in Q1 over the 17-year period and 61 per cent remained in Q5 over the same period. There are two interesting observations. First, higher income mobility in Q1 in Mahatwar relative to Harevli fits in with our understanding of composition of incomes in the two villages, and of greater diversification of income sources and greater reliance on incomes from outside the village among manual workers and poor peasants in Mahatwar as compared to those in Harevli village (see Dhar and Singh, 2025). Secondly, unlike Palanpur, in both the PARI villages, there was relative stability among the rich.
To conclude, the panel data show both the possibilities of change at the household level and the limits to such change. Overall, we observed more mobility in respect of incomes than land. Growth of incomes among the relatively poor, particularly landless and Scheduled Caste households, was notable and certainly presents a route to improved standards of living. Nevertheless, in the agrarian hierarchy of rural India where caste status and control over land remain crucial, even with higher incomes, lower income households remained at a huge disadvantage, and subject to various forms of discrimination as shown by papers in this issue (RAS 15, 2).
Acknowledgements: We thank Arindam Das, C. A. Sethu, and Sai Chandan Kotu for their help on this paper. We are grateful to Jens Lerche for his comments.
Notes
3 A few households were reclassified as a part of the neighbouring village of Rasulpur between 2006 and 2023.

4 To illustrate, consider the case of a Jatava household that did not own any crop land in 2006 and purchased 0.12 ha of land from a Tyagi household in 2021. Three members of this family were actively involved in agricultural labouring out and animal rearing. Two sons migrated (one worked in a hotel in Manali and the other worked as a painter in Dehradun) and both sent remittances.
5 Six of the eight households belonged to Scheduled Castes. There were varied reasons for the absolute fall in incomes, including one member’s retirement from a salaried job, division of land within the family, formation of a new household by the son, losses in business, and so on.
6 In Harevli, the overall income growth rate between 2006 and 2023 was 3.3 per cent (see Dhar and Singh 2025).
7 Of the 10, 4 belonged to Other Caste Hindus, 4 to Scheduled Castes, 1 to Other Backward Classes, and 1 was Muslim. The main reason for fall in incomes among Other Caste Hindu families was division of land and consequent reduction in operational land holding size and crop incomes. In two cases, the death of a family member was the main reason for the decline in income.
8 In both villages, the primary drivers of income growth were non-agricultural activities. The number of income sources from non-farm activities increased in both villages (see Dhar and Singh 2025). The growing importance of non-farm income in total incomes was highlighted by the Palanpur village studies. Himanshu and Nicholas Stern, in their detailed study, “How Lives Change: Six Decades in a North Indian Village,” found that the overall per capita income in the village doubled over the period 1983–2008 but per capita agricultural income remained constant. Non-farm incomes rose nearly fourfold (Himanshu and Stern 2018).
References
| Das, Arindam, Sekhar Dhar, Niladri, Munjal, Kunal, and Swaminathan, Madhura (2024), “Patterns of Income Growth in an Eastern Uttar Pradesh Village, 2006–23,” “Review of Rural Affairs,” Economic and Political Weekly, vol. 59, no. 43, pp. 54–61.
| |
| Dhar, Niladri, and Singh, Kulvinder (2025), “Patterns of Diversification in Rural Household Incomes: Evidence from a Longitudinal Study in Uttar Pradesh,” Review of Agrarian Studies, vol. 15, no. 2, p. 111–132.
| |
| Himanshu, Lanjouw, P., and Stern, N. (2018), “Poverty, Inequality, and Mobility in Palanpur,” in How Lives Change: Palanpur, India, and Development Economics. Progress in Development Studies, Oxford University Press, Delhi, pp. 299–348.
| |
| Himanshu, Lanjouw, P., and Stern, N. (2018), “Palanpur: The Village through Seven Decades,” in How Lives Change: Palanpur, India, and Development Economics. Progress in Development Studies, Oxford University Press, Delhi, pp. 48–76.
| |
| Himanshu, and Stern, N. (2018), “How Lives Change: Six Decades in a North Indian Village,” in Himanshu, Jha, Praveen, and Rodgers, Gerry (eds.), The Changing Village in India: Insights from Longitudinal Research, Oxford University Press, pp. 87–118.
| |
| Rodgers, Gerry, Mishra, Sunil K., and Sharma, Alakh N. (2016), “Four Decades of Village Studies and Surveys in Bihar,” in Himanshu, Jha, Praveen, and Rodgers, Gerry (eds.), The Changing Village in India: Insights from Longitudinal Research, Oxford University Press, pp. 119–154.
| |
| Srivastava, Ravi (2016), “Assessing Change: Land, Labour, and Employment in an Eastern Uttar Pradesh Village, 1994–2012,” in Himanshu, Jha, Praveen, and Rodgers, Gerry (eds.), The Changing Village in India: Insights from Longitudinal Research, Oxford University Press, pp. 194–229.
| |
| Swaminathan, Madhura (1991), “Measuring Mobility in Wealth: Some Estimates from a South Indian Village,” Oxford Bulletin of Economics and Statistics, vol. 53, no. 2, pp. 171–183.
| |
| Swaminathan, Madhura (2022), “Agrarian Inequalities in India” in Ramakumar, R. (eds.), Distress in the Fields: Indian Agriculture after Liberalization, Tulika Books, pp. 71–90.
|
Appendix
Appendix Figure 1 Proportion of longitudinal and panel households, by size-class of land holdings, Mahatwar, 2006 in hectares and per cent
Appendix Figure 2 Proportion of longitudinal and panel households, by size-class of land holdings, Mahatwar, 2023 in hectares and per cent
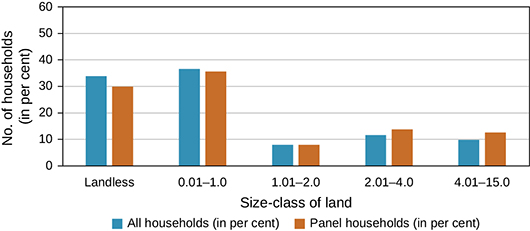
Appendix Figure 3 Proportion of longitudinal and panel households, by size-class of land holdings, Harevli, 2006 in hectares and per cent
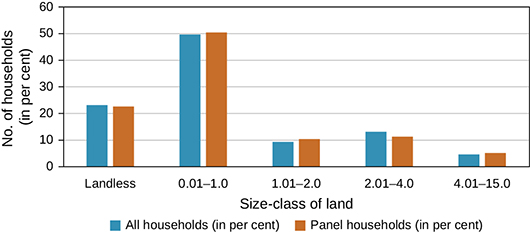
Appendix Figure 4 Proportion of longitudinal and panel households, by size-class of land holdings, Harevli, 2023 in hectares and per cent
Date of submission of manuscript: February 25, 2025
Date of acceptance for publication: May 15, 2025