

ARCHIVE
Vol. 15, No. 2
JULY-DECEMBER, 2025
Editorial
Research Articles
Referees
Socioeconomic Classes in Two Villages in Uttar Pradesh
*Associate Professor, Bihar Institute of Public Finance and Policy, Patna
https://doi.org/10.25003/RAS.15.02.0004
Abstract: This paper examines the identification and transformation of socio-economic classes in two villages of Uttar Pradesh between 2006 and 2023, with a focus on caste, class, and landholding dynamics. Our findings show that in Harevli in western UP and Mahatwar in eastern UP, class structures were shaped by access to land, tenancy, and machinery ownership. The upper classes – landlords and rich peasants – remained relatively stable, while the lower classes experienced some mobility, driven by changes in tenancy and wage labour participation and migration. Tenancy and rental machinery market were key mechanisms of control and exploitation of the poorer households by those at the top of the class hierarchy. Caste remained a significant determinant, reinforcing the economic dominance of upper classes across both villages.
Keywords: Agrarian relations, socio-economic class, caste, land, labour, exploitation, village study, Uttar Pradesh, India
Introduction
This paper attempts to identify the socioeconomic classes in two villages in Uttar Pradesh, namely Mahatwar and Harevli. Using data from surveys conducted in 2006 and 2023, we illustrate the changes in socioeconomic class positions over these two time periods. The paper is divided into three sections. In the first section, we discuss the demographic composition of the study villages and examine changes in the population over the 17-year period. The second section presents an analytical framework for identifying socioeconomic classes in the study villages, followed by a detailed analysis of various aspects of these classes including changes between 2006 and 2023. Features of the peasantry and rural proletariat are discussed further in Ramachandran and Sethu (this issue). The third section provides the conclusion.
An Introduction to the Study Villages
In the past two decades, the Foundation for Agrarian Studies (FAS) has conducted detailed village surveys in different agro-ecological zones across the country as part of its Project on Agrarian Relations in India (PARI). In 2006, Andhra Pradesh was the first state studied as part of this project. Till now, a total of 27 villages across 12 states have been surveyed. Some of these villages have also been revisited or resurveyed.
The broad objectives of the PARI surveys are:
- To analyse village-level production, production systems and livelihoods, and the socio-economic characteristics of different strata of the rural population;
- To conduct focused studies of sectional deprivation in rural India, particularly with regard to Dalit and Scheduled Tribe populations, women, specific minorities, and the income-poor; and
- To report on the state of basic amenities in villages and rural people’s access to the facilities of modern life.
In 2006, Uttar Pradesh was the second state chosen for study and a census-type survey covering all households was conducted in two villages: Harevli in Najibabad block, Bijnor district, western Uttar Pradesh and Mahatwar in Rasra tehsil (block) of Ballia district, eastern Uttar Pradesh (Figure 1).
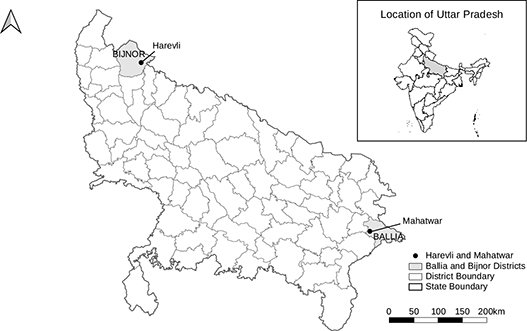
Figure 1 Map showing the districts and study villages, Harevli, Bijnor, and Mahatwar, Ballia, Uttar Pradesh, 2023
In June 2023, these villages were resurveyed. In Harevli, a census survey was carried out using a detailed household-level questionnaire, while in Mahatwar, the survey was conducted in two stages. First, information on demographics, land ownership, operational holding, and assets was canvassed from all households. Subsequently, a sample of 109 households (or half of the total households) was selected to collect detailed data on income, employment, and credit (see Appendix).
The detailed questionnaire comprised: questions on demography, ownership and operational land holdings of households, forms and terms of land tenure, cropping pattern, crop production and sale, use of inputs, ownership of means of production and other assets, labour use on operational holdings, agricultural and non-agricultural employment, and other non-agricultural sources of income, household amenities, and indebtedness. In addition, a supplementary module on migration was included in the 2023 survey.
Harevli
Location
The revenue village of Harevli is located in the Najibabad block of Bijnor district, Uttar Pradesh. The nearest town to Harevli, situated 4 km away, is Mandawali. Maujampur, also 4 km from the village, serves as the nearest railway station for Harevli’s residents. In both 2006 and 2023, the village did not have any bus stop. In 2023, the village had concrete approach roads, and e-rickshaws had become the primary means of transport for people and goods.
In addition to a primary school catering to classes I to V, a secondary school was established in the inter-survey period. The nearest primary health centre was located 4 km away in Mandawali. A block-level hospital was established between 2006 and 2023. While in 2006, Harevli did not have a bank branch, post office, or ration shop, in 2023, the village could access the bank branch and ration shop that had become operational in Mandawali.
Population
When the survey was conducted in the village in 2006, there were a total of 109 households and 661 residents (355 male and 306 female). In the resurvey in 2023, 129 households and 750 persons (395 male and 355 female) were covered. Notably, the sex ratio improved from 862 females per 1,000 males in 2006 to 899 females per 1,000 males in 2023.
In 2006, Jatava households were numerically the largest group, and in 2023, the Other Backward Classes comprised 33.3 per cent of the population and emerged as the largest social group. Historically, the Tyagi caste was the most socially and economically dominant caste in the village, constituting 26.4 per cent of the households in 2023. The average household size was 6.1 in 2006, which had declined to 5.8 in 2023. The distribution of households by social group has been provided in Table 1. Table 2 presents the detailed caste composition of the village population for 2006 and 2023.
Table 1 Distribution of households, by caste and social group, Harevli, 2006 and 2023 in numbers and per cent
| Caste and social group | 2006 | 2023 | ||
| No. of households | As share of all households (%) | No. of households | As share of all households (%) | |
| Jatava | 37 | 33.9 | 39 | 30.2 |
| Valmiki | 4 | 3.7 | 2 | 1.6 |
| Scheduled Caste | 41 | 37.6 | 41 | 31.8 |
| Dhivar | 22 | 20.2 | 41 | 31.8 |
| Badhai | 1 | 0.9 | 1 | 0.8 |
| Jat | - | - | 1 | 0.8 |
| Other Backward Class | 23 | 21.1 | 43 | 33.3 |
| Tyagi | 31 | 28.4 | 34 | 26.4 |
| Brahmin | 1 | 0.9 | 2 | 1.6 |
| Other Caste Hindu | 32 | 29.4 | 36 | 27.9 |
| Muslim | 13 | 11.9 | 9 | 7 |
| All | 109 | 100 | 129 | 100 |
Source: Project on Agrarian Relations in India (PARI) survey data, 2006 and 2023.
Table 2 Distribution of population, by caste, social group, and sex, Harevli, 2006 and 2023 in numbers
| Caste and social group | 2006 | 2023 | ||||
| Female | Male | Total | Female | Male | Total | |
| Jatava | 105 | 121 | 226 | 95 | 116 | 211 |
| Valmiki | 10 | 10 | 20 | 4 | 3 | 7 |
| Scheduled Caste | 115 | 131 | 246 | 99 | 119 | 218 |
| Dhivar | 63 | 77 | 140 | 104 | 122 | 226 |
| Badhai | 2 | 1 | 3 | - | 1 | 1 |
| Jat | - | - | - | 3 | 1 | 4 |
| Other Backward Class | 65 | 78 | 143 | 107 | 124 | 231 |
| Brahmin | - | 1 | 1 | 6 | 9 | 15 |
| Tyagi | 86 | 117 | 203 | 110 | 109 | 219 |
| Other Caste Hindu | 86 | 118 | 204 | 116 | 118 | 234 |
| Muslim | 40 | 28 | 68 | 33 | 34 | 67 |
| All | 306 | 355 | 661 | 355 | 395 | 750 |
Source: PARI survey data, 2006 and 2023.
As shown in Table 2, between 2006 and 2023, there was a decline in the Scheduled Caste population by 6 per cent, but there was a 9 per cent increase in the population of Other Backward Classes.
In Harevli, the number of migrants in 2023 was 97, with 48.5 per cent belonging to Tyagi households, followed by 20.6 percent from Jatava households. In the latest survey, we observed a shift from seasonal migration to long-term migration. In the FAS-PARI survey, seasonal migrants who considered the village as their place of residence are counted in the population figure. The reasons for and patterns of migration for these two castes differed significantly. Migrants from Tyagi households primarily left the village to pursue higher education or employment in the service sector in major cities. In contrast, members of Jatava households primarily migrated to engage in manual wage work in urban centres for more than 6 months (long-term migrant). There was also a decline in the number of Muslim households in the village.
Structure of landholdings
The crop land ownership in Harevli was highly skewed, with Other Castes owning 80 per cent of the land in 2023. The average size of crop land ownership stood at 3.2 acres in 2006 which fell to 2.6 acres in 2023. Of the total operated land, 41 per cent was leased in by cultivators in 2023, as compared to 28 per cent in 2006, and 36 per cent of the total land owned by the households was leased out in 2023 as compared to 21 per cent in 2006.
Cropping pattern and irrigation
As per Census 2011, the total geographical area of Harevli was 1,248 acres, of which 1,023 acres were classified as area under cultivation. The village comes under the command area of the Eastern Ganga Canal Project and was 100 per cent canal-irrigated. It is considered agriculturally advanced due to the availability of good irrigation facilities. Canals and tube wells remained the major sources of irrigation in the village over the years. Diesel and electric pumps with tube well were being used for irrigation. The major crops grown in Harevli were sugarcane, paddy, and wheat. Sugarcane, cultivated as an annual crop, accounted for 53 per cent of the gross cropped area (GCA) in 2006. This expanded to 66 per cent of the total GCA in 2023. Meanwhile, the share of paddy and wheat cultivation underwent a significant decline. For instance, wheat cultivation accounted for around 21 per cent of the GCA in 2006, which had declined to 14.7 per cent in 2023.
Mahatwar
Location
Mahatwar is located in Rasra tehsil of Ballia district in the eastern part of Uttar Pradesh. It is situated along the highway that connects Rasra and Mau. The village has a primary school, a middle school, and an Anganwadi centre. The regular means of transport from the village are bus, jeep, and auto services. The village roads are well connected. Pakwainar, the nearest town, is merely 2 km away from Mahatwar and well connected by road, allowing Mahatwar residents to access the railways from Pakwainar. However, the nearest health sub-centre is 6 km away, and the village has neither a bank nor a post office.
Population
The number of households in the village increased from 156 in 2006 to 218 in 2023 (Table 3). The average household size was 7.2 in 2006. In 2023, this declined to 6.3. Dalit households constituted 60 per cent of the total households in 2006 and 63 per cent of the total households in 2023. In 2006, there were 77 Jatava households (49 per cent of all households), and this number grew to 123 in 2023 (57 per cent of all households). Dusadh households declined from 17 to 13 in the same period. There were four Brahmin and nine Rajput households (7.6 per cent of all households) in 2006. The 2023 survey found a total of 5 Brahmin and 14 Rajput households. The rest of the population comprised persons from various castes grouped under the category of Other Backward Classes, notably Koiris and Yadavs. The numerical strength of Other Backward Classes also rose (from 50 to 60 households).
Table 3 Distribution of households, by caste and social group, Mahatwar, 2006 and 2023 in numbers and per cent
| Caste | 2006 | 2023 | ||
| No. of households | As share of all households (%) | No. of households | As share of all households (%) | |
| Jatava | 77 | 49.4 | 123 | 56.4 |
| Dusadh | 17 | 10.9 | 13 | 6 |
| Scheduled Caste | 95 | 60.9 | 136 | 62.4 |
| Baniya | 3 | 1.9 | 3 | 1.4 |
| Koiri | 18 | 11.5 | 24 | 11 |
| Lohar | - | - | 1 | 0.5 |
| Nai | 5 | 3.2 | 3 | 1.4 |
| Yadav | 23 | 14.7 | 31 | 14.2 |
| Other Backward Class | 48 | 30.8 | 62 | 28.4 |
| Brahmin | 4 | 2.6 | 5 | 2.3 |
| Rajput | 9 | 5.8 | 14 | 6.4 |
| Other Caste Hindu | 13 | 8.3 | 19 | 8.7 |
| Gond | - | - | 1 | 0.5 |
| Scheduled Tribe | - | - | 1 | 0.5 |
| All | 156 | 100 | 218 | 100 |
Source: PARI survey data, 2006 and 2023.
Table 4 presents the detailed caste composition of the village population for 2006 and 2023. The population grew by 33 per cent between 2006 (1,130 persons) and 2023 (1,506 persons). The Jatava caste (Scheduled Caste) had the largest population in the village, followed by the Yadav caste (Other Backward Class). The population of the Jatava caste increased significantly, while the population of Other Caste Hindus exhibited negligible growth (Table 4). The sex ratio fell from 1,014 in 2006 to 832 in 2023.
Table 4 Distribution of population, by caste, social group, and sex, Mahatwar, 2006 and 2023 in numbers
| Caste | 2006 | 2023 | ||||
| Female | Male | Persons | Female | Male | Persons | |
| Jatava | 258 | 281 | 539 | 384 | 424 | 809 |
| Dusadh | 56 | 47 | 103 | 35 | 43 | 77 |
| Scheduled Caste | 314 | 328 | 642 | 419 | 467 | 886 |
| Baniya | 19 | 13 | 32 | 9 | 9 | 18 |
| Koiri | 60 | 68 | 128 | 86 | 103 | 189 |
| Lohar | - | - | 0 | 3 | 2 | 5 |
| Nai | 17 | 17 | 34 | 12 | 15 | 27 |
| Yadav | 84 | 90 | 174 | 86 | 149 | 235 |
| Other Backward Class | 180 | 188 | 368 | 196 | 278 | 474 |
| Brahmin | 32 | 26 | 58 | 20 | 27 | 47 |
| Rajput | 35 | 27 | 62 | 46 | 47 | 93 |
| Other Caste Hindu | 67 | 53 | 120 | 66 | 74 | 140 |
| Gond | - | - | - | 3 | 3 | 6 |
| Scheduled Tribe | - | - | - | 3 | 3 | 6 |
| All | 561 | 569 | 1130 | 684 | 822 | 1506 |
Source: PARI survey data, 2006 and 2023.
Structure of landholdings
The distribution of crop land ownership was highly unequal in the village, with the top 10 per cent of households owning more than 50 per cent of the total crop land in 2023. The number of landless households in the village increased by 6 per cent between the survey years. The average size of ownership holding decreased from 1.2 acres in 2006 to 0.7 acres in 2023. The average size of operational holdings was 1.3 acres in 2006 which fell to 0.6 acres in 2023. In 2006, 39 per cent of the total operational holdings were cultivated by Other Caste Hindus, and this share had fallen to 18 per cent in 2023. On the other hand, the share of land operated by Dalits almost doubled, and the share of land operated by Other Backward Classes also increased in the 17-year period.
Cropping pattern and irrigation
As per Census 2011, the total geographical extent of Mahatwar was 365.7 acres, of which 311.4 acres were classified as net area sown and 303.9 acres as irrigated area. Irrigation was from groundwater using tube wells powered by diesel and electricity. The major crops grown in the village were paddy (kharif season) and wheat (rabi). Together, these constituted about 87 per cent of the GCA in 2006 and 85 per cent of the GCA in 2023. Vegetables were an important crop, cultivated primarily by Koiri (Kushwaha and Maurya) households. There was a notable expansion in vegetable cultivation, with its share in the GCA increasing from 2 per cent in 2006 to 10 per cent in 2023. In contrast, sugarcane, which was grown by large landowning households in 2006, had completely disappeared from the cropping pattern in 2023, mainly due to the closure of the sugar mill in Rasra (Das et al. 2024).
Non-agricultural employment
A large proportion of the population of Mahatwar village was engaged in manual work both in agriculture and non-agriculture occupations such as sinking tube wells or construction or worked under the Mahatma Gandhi National Rural Employment Guarantee Act (MGNREGA). Borewell digging has been a specialised occupation in the village among the Jatava households, acting as a stable source of income and employment throughout the survey years. Dalit women were engaged in bidi rolling in 2006, but in 2023, none remained in this occupation.
Migration played a significant role in the household economies of Mahatwar. Workers migrated to various places in India to take up semi-skilled and skilled non-agricultural wage work. Of the 268 migrants in 2023, 132 belonged to Scheduled Castes (predominantly Jatava), while 120 belonged to Other Backward Classes (OBC), predominantly Yadav. Labour migration was particularly high among Scheduled Caste households. The labour migration was male dominated, and the women who stayed back participated in the village production system.
Socioeconomic Classes in Uttar Pradesh
To identify socioeconomic classes in Mahatwar and Harevli, we used the framework and detailed methodology outlined in Ramachandran (2011) and Study Group (2016). The class structure in rural societies provides a useful framework for understanding the mode of production and the forms of exploitation taking place in the agrarian system. Within the classical political economy framework for class identification, three criteria – ownership and control over land and other means of production, labour ratio, and surplus generation within a production year – have been essential to understand. In both survey rounds (2006 and 2023), these three criteria were used to identify the socio-economic classes. Based on these three criteria, the clearly identifiable classes included – landlords, capitalist farmers, manual workers, other non-agrarian classes, and the peasantry. However, the differentiation of peasantry requires further examination of the following criteria.
- Ownership of means of production and other assets
- Labour ratio1
- Rent exploitation or rent received or paid by the household
- Net agricultural income, and
- Sources of income of the household
The entire peasantry was classified using these criteria. To delineate the boundaries of the peasant classes, levels of household asset ownership were used. Given that asset values, particularly that of land, vary across villages, the asset size classes were specific to each village.
The class of manual workers received a major share of total household income from wage earnings from manual work, in addition to other income sources such as cultivation of agricultural land, income from animal resources, and transfer payments (old age pensions, widow pensions, etc.). In this context, the location of migrant wage workers within an origin household was an important aspect to consider. Wage-labour migrants are considered as non-localised family.2 Consequently, the total wage labour and wage income of migrant workers was incorporated into the household labour use and household income in the village, rather than solely considering the remittances received from these migrant workers. The non-inclusion of the migrant wage labour in the household matrix would wrongly classify them within the class of remittances/pensions/rental income rather than as part of the class of manual workers.3 The non-agrarian classes were identified based on their sources and levels of income.
Business activity/self-employed: These are households whose primary source of income is derived from business activities or self-employment in the non-farm sector. This includes businesses of all sizes.
Remittances/pensions/rental income: These households are dependent on remittances or pension or rental income. As mentioned above, the labour and income of migrant wage workers are considered part of the household at the origin. Therefore, the remittances from migrant wage workers are not included in this class; rather, they are classified under the manual worker class.
Salaried person/s: These are households that primarily rely on salaried earnings as their main source of income.
Harevli
In Harevli, the class of landlord/capitalist farmers, comprising 4.7 per cent of all households, owned 30.4 per cent of agricultural land and 34.3 per cent of all assets (see Tables 5, 6, 7, and 8). All members of this class belonged to the Other Caste Hindu category, which included five Tyagi households and one Brahmin household. This class also diversified its sources of income. With the attainment of higher education among the members of these households, they secured highly remunerative salaried positions in both government and private sectors. In alignment with their class characteristics, these households derived as much as 31.4 per cent of their total income from rents received for agricultural land.
Table 5 Distribution of households, by socio-economic class, Harevli, 2023 in numbers and per cent
| Socio-economic class | Number | % |
| Landlord/big capitalist farmer | 6 | 4.7 |
| Rich peasant | 11 | 8.5 |
| Middle peasant | 21 | 16.3 |
| Lower peasant | 39 | 30.2 |
| Manual worker | 33 | 25.6 |
| Artisan work and work at traditional caste occupation | 1 | 0.8 |
| Business activity/self-employed | 6 | 4.7 |
| Salaried person/s | 2 | 1.6 |
| Remittances/pension/rental incomes | 10 | 7.8 |
| All households | 129 | 100 |
Source: PARI survey data, 2023.
Table 6 Distribution of households, by socio-economic class and caste, Harevli, 2023 in numbers
| Socio-economic class | Scheduled Caste | Other Backward Class | Other Caste Hindu | Total |
| Landlord/big capitalist farmer | - | - | 6 | 6 |
| Rich peasant | - | - | 11 | 11 |
| Middle peasant | 3 | 6 | 12 | 21 |
| Lower peasant | 15 | 22 | 2 | 39 |
| Manual worker | 17 | 16 | - | 33 |
| Artisan work and work at traditional caste occupation | - | 1 | - | 1 |
| Business activity/self-employed | - | 3 | 3 | 6 |
| Salaried person/s | 2 | - | - | 2 |
| Remittances/pension/rental incomes | 4 | 4 | 2 | 10 |
| All households | 41 | 52 | 36 | 129 |
Source: PARI survey data, 2023.
Table 7 Ownership of agricultural land, by socio-economic class and social group, Harevli, 2023 in acres
| Socio-economic class | Scheduled Caste | Other Backward Class | Other Caste Hindu | Total |
| Landlord/big capitalist farmer | - | - | 108.1 | 108.1 |
| Rich peasant | - | - | 98.4 | 98.4 |
| Middle peasant | 6.3 | 21.7 | 60.7 | 88.7 |
| Lower peasant | 16 | 16.9 | 6.4 | 39.2 |
| Manual worker | 2.2 | 3.1 | - | 5.3 |
| Artisan work and work at traditional caste occupation | - | - | - | - |
| Business activity/self-employed | - | - | 2.8 | 2.8 |
| Salaried person/s | 0.8 | - | - | 0.8 |
| Remittances/pension/rental incomes | 2.1 | 0.1 | 4.8 | 7 |
| All households | 27.4 | 41.8 | 281.2 | 350.4 |
Source: PARI survey data, 2023.
Table 8 Ownership of assets and means of production, by socio-economic class, Harevli, 2023 in rupees and per cent
| Socio-economic class | Assets | Means of production | ||
| Total (Rs) | Share (%) | Total (Rs) | Share (%) | |
| Landlord/big capitalist farmer | 262834600 | 34.4 | 2762300 | 18.1 |
| Rich peasant | 201827037 | 26.4 | 3527300 | 23.1 |
| Middle peasant | 182117116 | 23.8 | 4192816 | 27.4 |
| Lower peasant | 70476935 | 9.2 | 4317305 | 28.2 |
| Manual worker | 15732569 | 2.1 | 152600 | 1 |
| Artisan work and work at traditional caste occupation | 152700 | 0 | - | - |
| Business activity/self-employed | 10672450 | 1.4 | 341700 | 2.2 |
| Salaried person/s | 1037075 | 0.1 | - | - |
| Remittances/pension/rental incomes | 19671600 | 2.6 | - | - |
| All households | 764522082 | 100 | 15294021 | 100 |
Source: PARI survey data, 2023.
In Harevli, the peasantry derived 55 per cent of the total household income from agriculture. The identification of peasant households is based on the criteria of income derived from agriculture, labour ratio, and land tenurial status. In Harevli, 55 per cent of all households (71 out of 129) were classified as peasant households. Given the heterogeneity of the peasantry, different peasant classes were delineated based on asset criteria, as follows.
Rich peasant: Total asset value exceeding Rs 13 million.
Middle peasant: Total asset value of less than 13 million but more than Rs 4 million.
Lower peasant: Total asset value is less than 4 million but greater than 0.4 million.
The class of rich peasant constituted 8.5 per cent of all households, and all of them belonged to the socially influential Tyagi caste. They owned 28.1 per cent of the total agricultural land in the village and 26.4 per cent of the total assets. This class, just as that of landlord/ capitalist farmer, could be said to have engaged in capital accumulation in terms of purchase of land as well as means of production. This class received 61.9 per cent of their total household income from agricultural activities, including animal husbandry. In addition to self-cultivation, most households also earned rental income from agricultural land, which accounted for 10.4 per cent of their total household income. This class had the least diversified sources of income.
The class of middle peasants was caste heterogeneous, as Other Backward Classes and Scheduled Castes were also represented. However, 57.1 per cent of middle peasant households belonged to the Tyagi caste. This class owned 88.7 acres of land but operated 109.3 acres, indicating a prevalence of tenancy. The Dhivar households leased in a significant amount of land for cultivation. Households in this class derived 67.9 per cent of their income from agriculture. Similar to the class of rich peasants, the income sources of middle peasant households were less diversified. The Jatava and Dhivar middle peasant households participated in the wage labour market, while no Tyagi household hired out labour. The middle peasant households owned a major share of machinery in the village, and two Dhivar households earned a substantial portion of their household income from renting out agricultural machinery.
About 95 per cent of lower peasant households belonged to the Other Backward Classes and Scheduled Castes. These lower middle peasant households owned only 11.2 per cent of agricultural land but operated 32.9 per cent of the total operational land holdings. This indicates that lower middle households primarily functioned as tenants and were vulnerable to rent exploitation. The average size of land ownership per household was 1.1 acres, while they operated an average of 3.6 acres of land. Specifically, an Other Backward Class (Darzi/Idrisi, Dhivar) lower peasant household owned merely 0.8 acres of land but operated 4.3 acres of land.
The lower peasant households derived 47.5 per cent of their income from agriculture and 26.5 per cent of income from manual work. Among all peasant classes, these households had the most diversified sources of income, averaging nearly six sources per household.
The average labour ratio for the lower peasant class was 30.2, compared to just 5.8 for the middle peasant class. Furthermore, the utilisation of female labour in their own farms was significantly higher among the lower peasant class compared to other peasant classes. To provide context regarding the use of female labour in crop production, only 4 female labour days were spent on crop production by 25 Tyagi households within the peasant classes. In contrast, 1,503 female labour days were utilised for crop production by 40 Dhivar and Jatava households within the peasant classes.
For the manual worker class, a significant portion of income was derived from wage work in both the agricultural and non-agricultural sectors. In Harevli, 25.6 per cent of households belonged to this class. Although it has been argued that the manual worker class is caste heterogeneous, in this village the Jatava and Dhivar (Scheduled Castes) exclusively constituted this class (Dhar and Kaur 2013). Fifty-one per cent of manual worker households were landless, and the average land ownership among the remaining households was 0.33 acres. On average, 82 per cent of household income was generated from wage work in both sectors. Due to the labour-intensive nature of sugarcane cultivation in the village, manual worker households earned substantial wages from agricultural work. The income sources for manual worker households were not diversified, as they typically derived their income from an average of four sources.
The non-agrarian classes were identified based on their sources and levels of income.
Artisan work and traditional caste occupation: Households whose primary source of income comes from participation in socially and historically defined caste activities or artisanal work (such as carpentry, barbering, etc.). In Harevli, one household belonging to the Badhai caste was classified under this class.
Business activity/self-employed: Households engaged in business activities or self-employment primarily in the non-farm sector are classified as self-employed. This category encompasses businesses of all sizes. Out of 129 households, six were identified as belonging to this class, three households belonged to the Tyagi caste (Other Caste Hindu), while the other three belonged to Other Backward Classes (Darzi/Idrisi and Dhivar castes). All of these households were engaged in small-scale enterprises.
Salaried person/s: These are households whose primary source of income is derived from salaried employment. Both households in this class have members employed in government posts.
Remittances/pensions/rental income: These households are dependent on remittances, pensions, or rental income. The primary source of income for these households is transfer earnings. In this village, 7.8 per cent of households belonged to this category, and most of them belonged to Scheduled Castes and Other Backward Classes. Remittance earnings served as the primary source of income for 60 per cent of these households. As mentioned earlier, the nature and duration of migration for such households have changed over time. Manual workers now migrated to urban locations for periods exceeding six months and sent remittances to their households at the place of origin.
Changes in the Class Position of Households Between 2006 and 2023
In Harevli, the class positions of 115 households were matched between 2006 and 2023 (Table 9). In 2006, the peasantry was differentiated into four distinct classes, while in 2023, it was reduced to three classes. The nomenclature for peasant classes changed between 2006 and 2023; specifically, Peasant: 2 (upper middle) and Peasant: 3 (lower middle) from 2006 correspond to the middle peasant class in 2023. Additionally, Peasant: 3 (lower middle) and Peasant: 4 (poor) from 2006 align with the lower peasant class in 2023.
Table 9 Change in socioeconomic class position of households between 2006 and 2023, Harevli in numbers
| 2006\2023 | Landlord/big capitalist farmer | Rich peasant | Middle peasant | Lower peasant | Manual worker | Artisan work and work at traditional caste occupation | Business activity/self-employed | Salaried person/s | Remittances/pension/rental incomes | All |
| Landlord | 4 | - | - | - | - | - | - | - | - | 4 |
| Peasant: 1 (rich) | 2 | 4 | 5 | - | - | - | 1 | - | - | 12 |
| Peasant: 2 (upper middle) | - | 4 | 5 | 3 | - | - | - | - | 1 | 13 |
| Peasant: 3 (lower middle) | - | 1 | 8 | 11 | - | - | 1 | 1 | 22 | |
| Peasant: 4 (poor) | - | - | - | 13 | 17 | 1 | 1 | 1 | 33 | |
| Hired manual worker | - | - | - | 5 | 12 | - | - | 1 | 2 | 20 |
| Artisan work and work at traditional caste occupation | - | - | - | - | - | 1 | - | - | - | 1 |
| Business activity/Self-employment | - | - | - | 1 | - | - | 2 | 3 | ||
| Salaried person/s | - | - | 1 | 3 | - | - | - | - | 1 | 5 |
| Remittances, pensions, small rents | - | - | - | - | - | - | - | - | 2 | 2 |
| All | 6 | 9 | 19 | 36 | 29 | 1 | 5 | 2 | 8 | 115 |
Source: PARI survey data, 2006 and 2023.
All four landlord households from 2006 maintained their class status in 2023. Among the 12 Peasant: 1 (rich) households, one-third retained their class position, while two households ascended to the class of landlord/big capitalist farmers in 2023. However, 41.7 per cent of Peasant: 1 (rich) households transitioned to the class of middle peasants in 2023. The primary reason for the downward mobility of these households was the division of households, which consequently led to the division of land among the separated households. For instance, during the 2006 round, a household owned 15 acres of land; by 2023, the household had split into two separate households, each owning 6.6 acres of land. Similar instances were also observed among other households. The reasons for the upward mobility of four households classified as Peasant: 2 (upper middle) in 2006 to Rich Peasant status in 2023 included a substantial increase in land values, the addition of other sources of income, and a rise in income levels from crop production. In some cases, these households acquired agricultural land during the inter-survey years. Conversely, the movement of three households from Peasant: 2 (upper middle) in 2006 to Lower Peasant status in 2023 was primarily due to the loss of agricultural land during the inter-survey years.
In 2006, the class of Peasant: 4 (poor) constituted the largest in the village. Out of 33 households, 13 maintained their class position, while 17 transitioned to manual worker households by 2023. Most individuals in this class were semi-proletarian tenant peasants without land or with unviable landholdings. Of the 17 households, 10 had leased land in 2006; however, in 2023, they did not enter into any tenancy contracts and became solely dependent on the wage labour market for their household income.
Furthermore, in 2006, 20 households were classified as manual workers, and by 2023, five of these households had transitioned to the category of lower peasant. Of the five households that moved to the lower peasant class, four leased land for cultivation in 2023, whereas they had engaged in wage labour in 2006. With the change in the tenurial status of these households from tenant peasant to pure proletariat, their class position also shifted from peasant to manual worker. Another notable observation was that the division of households was more pronounced among the Scheduled Caste households belonging to the poorer sections of the peasantry and the manual worker class in this village.
Mahatwar
Based on the criteria, nine socio-economic classes were identified in Mahatwar. At the top of this hierarchy were the landlord/big farmers, who owned the most fertile land. The strategic locations of their plots provided them with a significant advantage in the land market. They engaged in crop production either by leasing out land or by hiring wage labour to perform all manual work. In the 2022–23 period, they leased out approximately 28 per cent of their land, while the remainder was cultivated by wage labour. Given their social and economic status within the village, they did not participate in any manual labour related to crop production. In this village, 1.8 per cent of all households belonged to this class, and all of them were Brahmins (see Tables 10, 11, 12, and 13). They owned 19 per cent of agricultural land and 55.1 per cent of the total assets of the village. The data also indicated that they diversified their sources of income. Over the years, their household economy shifted away from reliance on crop production, leading to a significant decline in the share of income derived from agricultural activities. Nevertheless, their historical dominance in land ownership and their elevated caste status continued to confer social power, which enabled them to effectively control both tenants and wage workers.
Table 10 Distribution of households by socio-economic class, Mahatwar, 2023 in numbers and per cent
| Socio-economic class | Number | % |
| Landlord/Big farmer | 4 | 1.8 |
| Upper peasant | 11 | 5 |
| Middle peasant | 31 | 14.2 |
| Lower peasant | 47 | 21.6 |
| Manual worker with operational holding | 82 | 37.6 |
| Manual worker without operational holding | - | - |
| Business activity/self-employed | 12 | 5.5 |
| Remittances/pensions/rental income | 24 | 11 |
| Salaried person/s | 7 | 3.2 |
| All households | 218 | 100 |
Source: PARI survey data, 2023.
Table 11 Distribution of households, by caste and social group, Mahatwar, 2023 in numbers
| Socio-economic class | Scheduled Caste | Scheduled Tribe | Other Backward Classes | Other Caste Hindu | Total |
| Landlord/Big farmer | - | - | - | 4 | 4 |
| Upper peasant | - | - | 3 | 8 | 11 |
| Middle peasant | 6 | 1 | 24 | - | 31 |
| Lower peasant | 35 | - | 11 | 1 | 47 |
| Manual worker with operational holding | 51 | - | 7 | - | 58 |
| Manual worker without operational holding | 22 | - | 2 | - | 24 |
| Business activity/self-employed | 7 | - | 5 | - | 12 |
| Remittances/pensions/rental income | 12 | - | 7 | 5 | 24 |
| Salaried person/s | 3 | - | 3 | 1 | 7 |
| All households | 136 | 1 | 62 | 19 | 218 |
Source: PARI survey data, 2023.
Table 12 Ownership of agricultural land, by socio-economic class and social group, Mahatwar, 2023 in acres
| Socio-economic class | Scheduled Caste | Scheduled Tribe | Other Backward Class | Other Caste Hindu | Total |
| Landlord/Big farmer | - | - | - | 35.6 | 35.6 |
| Upper peasant | - | - | 21.8 | 19.5 | 41.3 |
| Middle peasant | 7.5 | 0.7 | 33 | - | 41.2 |
| Lower peasant | 13.2 | - | 12.2 | - | 25.4 |
| Manual worker with operational holding | 4.8 | - | 2.4 | - | 7.3 |
| Manual worker without operational holding | - | - | - | - | 0 |
| Business activity/self-employed | 1.1 | - | - | - | 1.1 |
| Remittances/pensions/rental income | 2.5 | - | 22.6 | 5.1 | 30.1 |
| Salaried person/s | 2.5 | - | 1 | 2.1 | 5.5 |
| All households | 31.6 | 0.7 | 93.0 | 62.3 | 187.5 |
Source: PARI survey data, 2023.
Table 13 Ownership of assets and means of production, by socio-economic class, Mahatwar, 2023 in rupees and per cent
| Socio-economic class | Assets | Means of production | ||
| Total (Rs) | Share (%) | Total (Rs) | Share (%) | |
| Landlord/Big farmer | 1509514500 | 55.1 | 10000 | 0.2 |
| Upper peasant | 524338220 | 19.2 | 2417199 | 46.8 |
| Middle peasant | 244028222 | 8.9 | 732582 | 14.2 |
| Lower peasant | 96330854 | 3.5 | 16920 | 0.3 |
| Manual worker with operational holding | 37875027 | 1.4 | 8874 | 0.2 |
| Manual worker without operational holding | 8030111 | 0.3 | - | 0 |
| Business activity/self-employed | 16519526 | 0.6 | 33212 | 0.6 |
| Remittances/pensions/rental income | 242475435 | 8.9 | 1927050 | 37.3 |
| Salaried person/s | 58514748 | 2.1 | 22800 | 0.4 |
| All households | 2737626643 | 100 | 5168637 | 100 |
Source: PARI survey data, 2023.
On the other end of the agrarian spectrum, the class of manual workers in the village was substantial, with 37.6 per cent of all households belonging to this category. As noted in other PARI study villages, the manual worker class has been predominantly populated by Scheduled Castes and Other Backward Classes. Mahatwar was no exception to this trend. In this village, the Jatava and Dusadh castes (Scheduled Castes) comprised the majority of the manual worker class. Among all manual worker households, 89 per cent belonged to Scheduled Castes. Furthermore, 53.7 per cent of Scheduled Caste households were classified as manual worker households. Forty-five per cent of manual worker households were landless, and for the remaining households, the average land ownership was only 0.16 acres.
In Mahatwar, the class of manual workers was further differentiated into two classes: manual workers with operational holdings and manual workers without operational holdings.
Manual workers with operational holdings had some ownership holdings and leased in small plots of land for cultivation. This class owned just 3.9 per cent of the agricultural land but operated 15.7 per cent of the total operational holdings in the village. They had diversified sources of income, with labour migration serving as a significant source of employment and income for these households. The labour ratio for these households was notably high, indicating substantial engagement in both agricultural and non-agricultural wage work, with only a small amount of labouring out during peak crop seasons.
The class of manual workers without operational holdings was primarily engaged in wage labour, predominantly in non-agricultural sectors. They derived a significant portion of their household income from this wage work. In Mahatwar, borewell digging has been a major non-agricultural activity. A large number of Jatava and Dusadh households participate in this occupation. Almost all Jatava and Dusadh households were engaged in borewell digging, thus categorised within the class of manual workers. They spent a considerable amount of their labour time in borewell digging, earning a substantial share of their income from this activity.
In Mahatwar, the agricultural sector was characterised by low productivity and limited farm diversification (Johnson and Modak, 2025, this issue), which resulted in constrained income generation from farming. Consequently, households increasingly diversified their sources of income, a process shaped by the educational attainment and skills of household members. This diversification of sources of income away from agriculture significantly reduced the proportion of agricultural income in the total household income. And since the share of income from agriculture in the total household income is a crucial criterion for identifying peasant households, the low share of agricultural income complicated the identification of peasant households. Notably, the share of net agricultural income was found to be less than 20 per cent of the total household income in Mahatwar, suggesting a potential process of de-peasantisation or the disappearance of the peasantry from the village. However, a closer examination revealed that households continue to engage in agriculture primarily for food security, even as they invest time and resources in non-agricultural activities. Despite consistently low net returns from agriculture over an extended period, these households did not abandon farming. While they devoted their time and effort to other economic activities, they anchored their household economies in agriculture to ensure food security before pursuing economic opportunities beyond the agricultural sector. It was also observed that, in some cases, particularly among the lower strata of the peasantry, cash earnings from non-agricultural activities were used to lease land. The prohibitively high land prices and inadequate income from non-agricultural activities compelled them to access land for crop production through tenancy rather than through land purchase.4 This situation necessitated the use of a more nuanced set of indicators to accurately identify peasant households. Instead of relying solely on net agricultural income, we propose adopting the gross value of output (GVO) from agriculture as a more appropriate measure. This would be in addition to other criteria, such as land ownership, labour utilisation, and income diversification, to define peasantry more comprehensively.
In Mahatwar, the GVO from agriculture constituted 35.6 per cent of the total household income. The net agricultural income was only 33.2 percent of the GVO, indicating that a substantial portion of agricultural revenue was expended on inputs. Given that GVO is positively correlated with total household income, it serves as a useful indicator of a household’s engagement in agriculture. Therefore, we resorted to the use of GVO to identify peasant households more effectively (see, also, Ramachandran and Sethu, this issue).
Based on the village-level distribution of agricultural production, a threshold annual GVO of Rs 6,000 from crop production and animal husbandry was determined by analysing its distribution at the village level. This GVO-based identification criterion was developed specifically for the context of Mahatwar. To effectively identify peasant households, we define them as those that derive more than Rs 6,000 from crop production and animal husbandry within a single agricultural year. Using GVO along with other criteria convincingly demonstrates that, despite the growth of the non-agricultural economy in the village and nearby towns, the household economy of the peasantry has continued to revolve around crop production and animal husbandry.
To differentiate among peasant classes, the criterion of asset ownership was employed. This criterion effectively addresses the boundary problem typically encountered when identifying specific peasant classes. It may be surprising that land values in Mahatwar are high despite low agricultural productivity. The high land values are partly due to some agricultural land adjoining a State highway. Given the low volume of land transactions in this village, the reported land prices are speculative. In most cases, this speculation is driven by the anticipated increase in commercial activities and the emergence of real estate development along the highway. In this village, the categories of asset ownership were as follows:
Upper peasant: The upper peasant households had asset ownership ranging from Rs 20 million to Rs 90 million.
Middle peasant: These peasant households had asset ownership ranging from Rs 4 million to Rs 20 million.
Lower peasant: These peasant households had asset ownership ranging from Rs 0.5 million to Rs 4 million.
In Mahatwar, 40.8 per cent households belonged to various peasant classes. The upper peasant class constituted 5 per cent of all households and owned 22 per cent of the agricultural land. Seventy-one per cent of the households in this class belonged to Other Caste Hindus (Brahmin, Thakur, and Rajput), while the remaining households were Yadav. A comparison of class status between 2006 and 2023 revealed that 27.9 per cent of the households in the upper peasant class were descendants of the landlord class from 2006. Moreover, the Yadav households in the upper peasant class advanced from the middle section of the peasantry. Furthermore, their asset ownership was 19.2 per cent of the total assets in the village, and they controlled 46.8 per cent of the total means of production. Recently, three households within this class initiated a machine rental business in the village. Most households in this class derived income from multiple sources, including business ventures, government and private salaried jobs, and remittances. Although these households purchased some means of production, it was not capital accumulation in the strict sense of the term. These purchases were merely for capturing the rental market for agricultural equipment in the village and to diversify to another income source.
The labour ratio of this class was just one as the labour for the production process of the upper peasant class primarily came from the wage labour market. Furthermore, the participation of family labour, including female family labour in crop production, was negligible, accounting for only 2.5 per cent of total family labour use. Moreover, they did not sell their labour for any wage work, either in the village or elsewhere.
The class of middle peasants comprised 14.2 per cent of all households. This class comprised of Other Backward Classes (Nai, Koiri, and Yadav) and Scheduled Castes (Jatava and Dusadh). Households within this class owned 22 per cent of total agricultural land; however, their operational land holdings exceeded their ownership holdings. Their income sources were more diversified, including petty businesses, remittances, and borewell sinking. The labour ratio for middle peasant households was 41, implying the majority of labour for own crop production came from family members. Additionally, the participation of female family labour was notably high in this class. The female family members in this class contributed 25.2 per cent of the total family labour use. Furthermore, the middle peasant households sold their labour in the non-agricultural wage labour market; however, none of these households participated in the agricultural wage labour market within the village.
The class of lower peasants, comprised land-poor Scheduled Castes (Jatava and Dusadh) and Other Backward Classes such as Yadav and Koiri, constituted 21.6 per cent of all households in the village. This class owned 13.5 per cent of the agricultural land but operated 26.3 per cent of the total operational holdings. Crop production for this class primarily depended on tenancy arrangements, with family members serving as the main source of labour, particularly female family members. Of the total family labour use, 29.4 per cent was contributed by female family members. The average labour ratio for this class was as high as 106. Apart from working on their own farms, they sold their labour power in the non-agricultural wage labour market, while participation in the agricultural wage labour market was negligible. In this village, 20 out of 47 lower peasant households sold their labour in the non-agricultural wage labour market and worked an average of 208 days during the survey year. The primary income sources for these households included remittances from labour migration, borewell sinking, and small-scale businesses.
The non-agrarian classes (business activity/self-employed, remittances/pensions/rental income, salaried person/s) comprised 19.7 per cent of all households in the village. These classes were caste heterogeneous. The class of remittances/pensions/rental income owned 16.1 per cent of agricultural land but leased out a substantial portion of it to generate rental income. The class of salaried person/s was mostly employed in the government sector, while other sources of income for this class were small businesses in nearby towns.
Changes in the Class Position of Households Between 2006 and 2023
In this section, we discuss the changes in the class positions of households in the study villages. Between 2006 and 2023, we identified 83 panel households (Table 14). Although the class nomenclature changed marginally between the two rounds of surveys, a comparison of classes between the two survey years was possible, as the criteria for identifying classes remained the same, except for using GVO from agriculture as a criterion to identify peasantry in Mahatwar. Table 14 illustrates that the class positions of households did not change significantly. Among agrarian classes, significant class mobility was observed among Peasant: 4 (poor) households from 2006. Out of 18 households, eight were able to retain their class position and remained classified as lower peasants in 2023. The remaining eight Peasant: 4 (poor) households from 2006 transitioned to manual worker classes, with five households moving into the class of manual workers with operational holdings and three households shifting to the class of manual workers without operational holdings in 2023. In both survey rounds, tenants primarily constituted this class. Short-term unregistered tenancy was prevalent in the village in both rounds. Because of insecure tenancy and the lack of other means of production, the boundary between the classes of poor peasants and manual workers remained blurred. When land becomes available for tenancy, landless households, primarily those that supply labour, engage in crop production. For that specific production year, they transition from the class of manual workers to the class of poor peasants. Consequently, the class positions of these two classes frequently change based on their participation in the rural production system. It is important to emphasise that the demographic characteristics of these households, the educational qualifications of their members, and the ownership of assets, including means of production, were similar. Access to land through tenancy distinguished them as manual workers and lower peasants in a given production year. This also suggests that class positions are dynamic over the long term, as these households explore various livelihood options to find the best possible combination for ensuring household welfare. Among non-agrarian classes, only two households consistently belonged to the class of business activity/self-employed, and the class positions of nine households shifted between 2006 and 2023.
Table 14 Change in socioeconomic class position of households between 2006 and 2023, Mahatwar in numbers
| 2006\2023 | Landlord/Big farmer | Upper peasant | Middle peasant | Lower peasant | Manual worker with operational holding | Manual worker without operational holding | Business activity/self-employed | Remittances/pensions/rental income | Salaried person/s | All |
| Landlord | 2 | 2 | - | - | - | - | - | - | - | 4 |
| Peasant: 1 (rich) | 1 | 1 | - | - | - | - | - | - | 2 | |
| Peasant: 2 (upper middle) | - | 3 | - | - | - | - | - | 1 | - | 4 |
| Peasant: 3 (lower middle) | - | 1 | 7 | 3 | - | - | - | 2 | - | 13 |
| Peasant: 4 (poor) | - | - | - | 8 | 5 | 3 | - | 1 | 1 | 18 |
| Hired manual worker | - | - | 1 | - | 14 | 1 | - | 1 | - | 17 |
| Business activity/Self-employment | - | 1 | 2 | 5 | 1 | - | 2 | - | - | 11 |
| Remittances, pensions, small rents | - | - | 2 | 1 | - | - | 1 | 2 | - | 6 |
| Salaried person/s | - | - | - | 3 | - | - | - | 2 | 3 | 8 |
| All | 3 | 7 | 13 | 20 | 20 | 4 | 3 | 9 | 4 | 83 |
Source: PARI survey data, 2006 and 2023.
Concluding Remarks
This paper addressed the identification of socio-economic classes in two villages in Uttar Pradesh. In both villages, the correlation between caste, class, and landholding was strong. This correlation was particularly pronounced in the agriculturally prosperous village of Harevli, located in western Uttar Pradesh. In both villages, the rich landowning classes resorted to tenancy to exploit the working population. The ownership of agricultural machinery among the capitalist farmers, and richer section of peasantry also helped them dominate the rental market for machinery. The lower sections of the peasantry in both villages lacked agricultural land and other essential means of production. The landlord/big capitalist farmer, along with the richer section of the peasantry, controlled the middle and lower sections of the peasantry through tenancy arrangements and the rental market for agricultural machinery. In Mahatwar, the agricultural wage labour market was saturated with workers from the classes of manual worker and lower sections of the peasantry who sought wage work in the non-agricultural sector. The primary income sources for these households included remittances from labour migration, borewell sinking, and small-scale businesses. In contrast, in Harevli, the lower peasant class, along with the manual worker class, participated actively in the agricultural wage labour market.
The comparison of class positions between the two time periods, 2006 and 2023, revealed two significant processes that have occurred over the 17-year span. First, the class status of the upper section of the socioeconomic classes, which includes landlords, capitalist farmers, rich peasants, remained relatively stable over the years. Any transitions from one class to another were primarily due to the separation of households and, consequently, the division of means of production, particularly land, during the intervening years. Second, the class positions of land-poor peasant classes and manual worker class frequently changed because of their participation in the rural production system through tenancy. Although the demographic characteristics of these households, the educational qualifications of their members, and their asset ownership were similar, access to land through tenancy distinguished manual workers from lower peasants in a given production year.
Acknowledgements: I thank V. K. Ramachandran, Arindam Das, and C. A. Sethu for several rounds of detailed discussions during the class analysis of the study villages. I thank Rithika Pulagiri and Arindam Das for preparing the village description section of this paper. I am grateful to the FAS team, particularly Arindam Das, for preparing the data used in this paper. I am also grateful to Jens Lerche, whose comments and suggestions have significantly improved the paper.
Notes
1 The labour ratio is defined as the proportion of total labour supplied by the household – comprising both family labour utilised on their own farm and labour provided to other farms – relative to the total labour demanded by the household, which includes the total number of labour days hired in by the household.

2 See Gonzalez (1960).
3 For more details see Dhar et al. (2022).
4 See also Bansal (2020).
References
| Bansal, Gaurav (2020), “Tenancy and Accumulation: A Study of the Capitalist Farm Sector in Punjab,” Review of Agrarian Studies, vol. 10, no. 2, available at http://ras.org.in/tenancy_and_accumulation, viewed on April 10, 2025.
| |
| Das, Arindam, Sekhar Dhar, Niladri, Munjal, Kunal, and Swaminathan, Madhura (2024), “Patterns of Income Growth in an Eastern Uttar Pradesh Village, 2006–23,” “Review of Rural Affairs,” Economic and Political Weekly, vol. 59, no. 43, pp. 54–61.
| |
| Dhar, Niladri Sekhar, and Kaur, Navpreet (2013), “Features of Rural Underemployment in India: Evidence from Nine Villages,” Review of Agrarian Studies, vol. 3, no. 1, available at http://ras.org.in/features_of_rural_underemployment_in_india, viewed on June 20, 2025.
| |
| Dhar, Niladri Sekhar, Pandey, Mrityunjay, and Kumar, Awanish (2022), “Identifying Socio-Economic Classes in Two Villages of Bihar,” Review of Agrarian Studies, vol. 12, no. 1, available at http://ras.org.in/identifying_socio_economic_classes_in_two_villages_of_bihar, viewed on November 20, 2024.
| |
| Gonzalez, Nancie L. Solien (1960), “Family and Household in the Caribbean,” Social and Economic Studies, 9, pp. 101–06.
| |
| Johnson, D. and T. S. Modak (2025), “Economics of Farming in Mahatwar, Uttar Pradesh” Review of Agrarian Studies, vol. 15, no. 2, p. 71–87.
| |
| Ramachandran, V. K. (2011), “The State of Agrarian Relations in India Today,” The Marxist, vol. 27, no. 1–2, pp. 51–89.
| |
| Ramachandran, V. K. and C. A. Sethu (2025), “Peasants and Proletarians in Harevli and Mahatwar,” Review of Agrarian Studies, vol. 15, no. 2, pp. 61–70.
| |
| Report of the Study Group on Agrarian Classes (Study Group), (2016), The Marxist, vol. 32, no. 2, Apr-Jun, pp. 1–36.
|
Appendix
In Mahatwar, a detailed questionnaire was used for 109 sample households that comprised 50 per cent of the total population (Appendix Table 1). A stratified random sample was chosen with caste as the primary strata followed by the substrata based on land ownership. For castes that exhibited significant variation in land ownership, the size class of land ownership was used as substrata with caste as the primary stratum. These castes included Jatava, Yadav, Koiri, Dusadh, and Rajput. For households from the remaining castes, that comprise smaller population sizes or show less variability, a simpler approach without land substratum was adopted. Multipliers were used to ensure the representativeness of the sample for the total population.
Appendix Table 1 Distribution of households in the population and sample, by caste, Mahatwar, 2023 in numbers and per cent
| Caste | No. of households in the population | No. of households in the sample | Households sampled (%) |
| Jatava | 123 | 60 | 48 |
| Yadav | 31 | 16 | 52 |
| Koiri | 24 | 7 | 29 |
| Dusadh | 14 | 9 | 64 |
| Rajput | 14 | 10 | 71 |
| Brahmin | 5 | 4 | 80 |
| Baniya | 3 | 1 | 33 |
| Nai | 3 | 1 | 33 |
| Gond | 1 | 1 | 100 |
| Lohar | 1 | 1 | 100 |
| All | 219 | 110 | 50 |
Source: Project on Agrarian Relations in India (PARI) survey data, 2023.
Date of submission of manuscript: May 5, 2025
Date of acceptance for publication: August 5, 2025